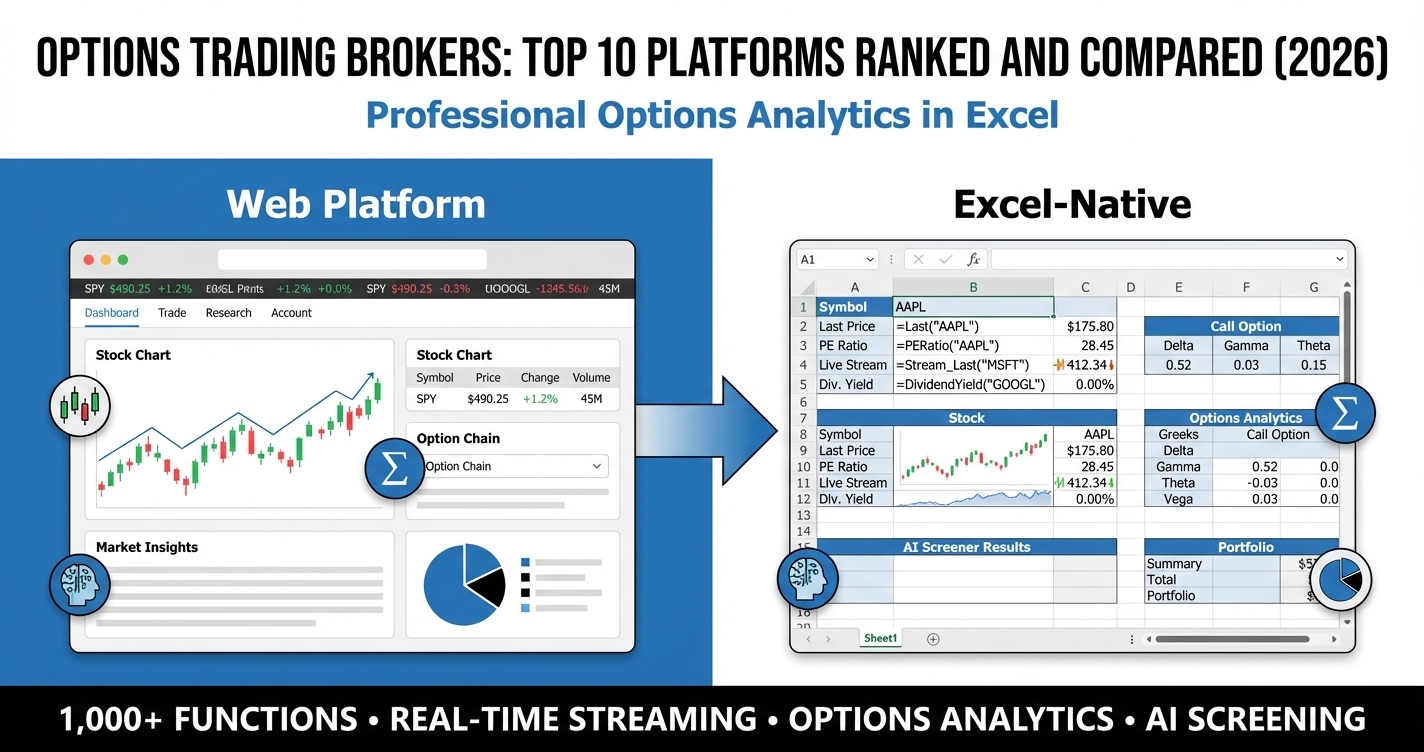
Options trading brokers ranked by commissions, platform quality, research tools, and execution - comparing the top 10 platforms for options traders in 2026.
Options Trading
Expert insights on stock market analysis, investment strategies, and Excel techniques for smarter investing.
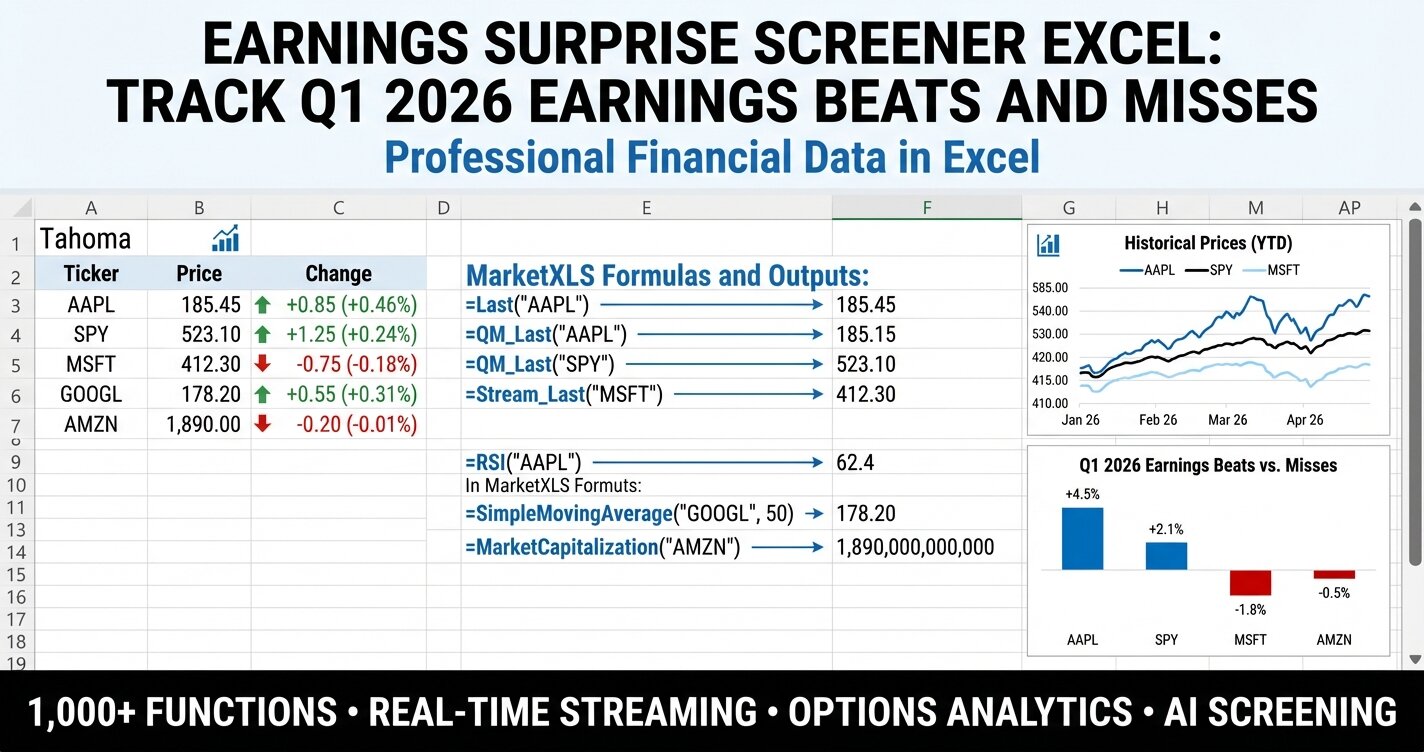
Earnings surprise screener Excel - build a real-time earnings tracker that identifies Q1 2026 beats and misses across 15 major stocks using live MarketXLS formulas.
Options trading brokers ranked by commissions, platform quality, research tools, and execution - comparing the top 10 platforms for options traders in 2026.
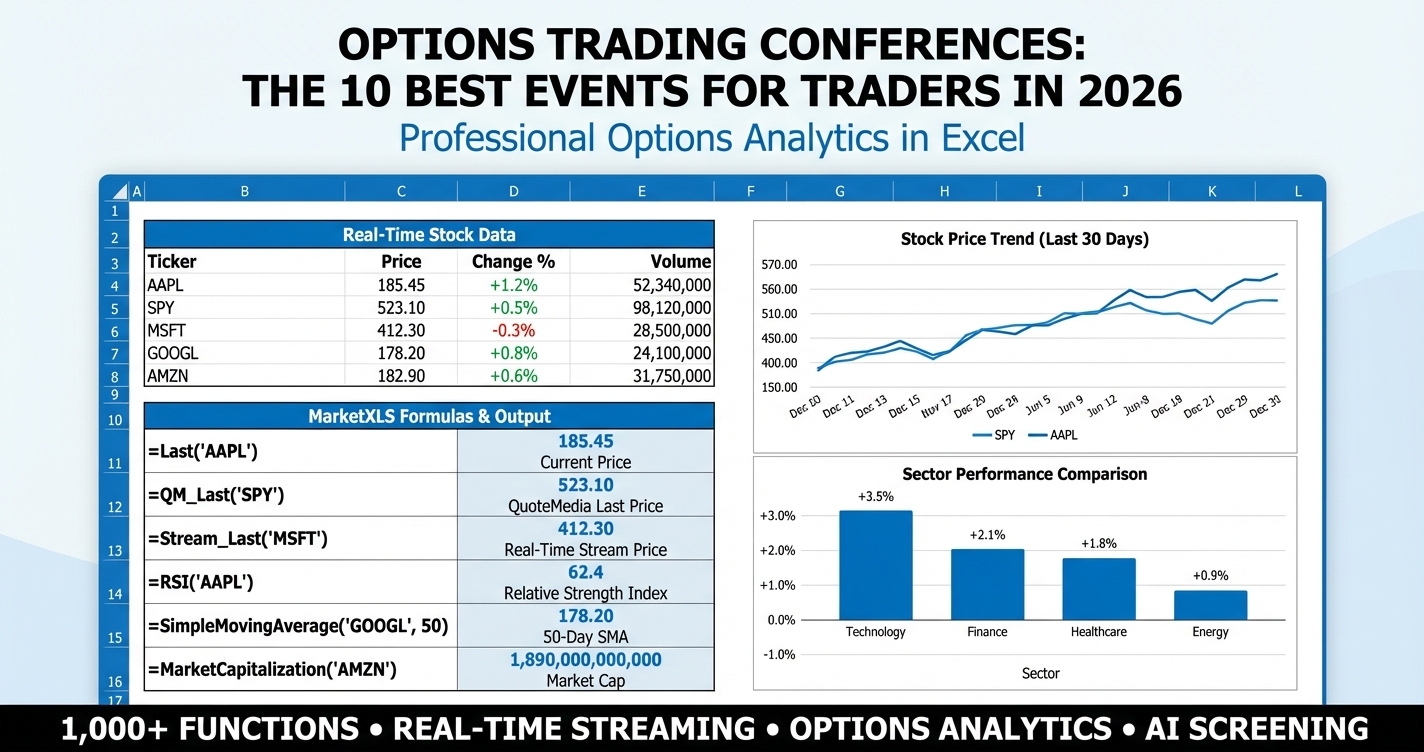
Options trading conferences ranked for 2026 - the 10 best events for learning strategies, networking with professionals, and staying ahead in the options market.
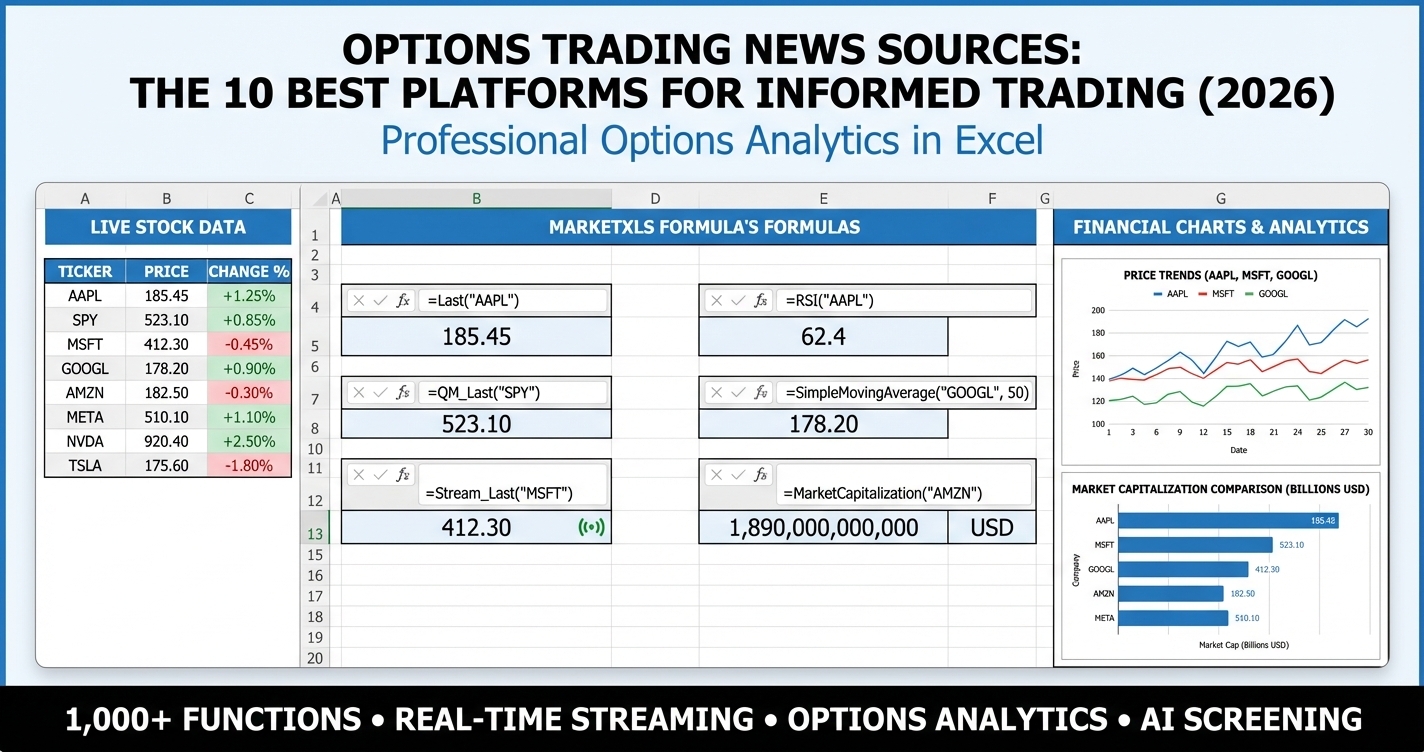
Options trading news sources ranked by speed, credibility, and analytical depth - covering the 10 best platforms trusted by professional and retail options traders in 2026.
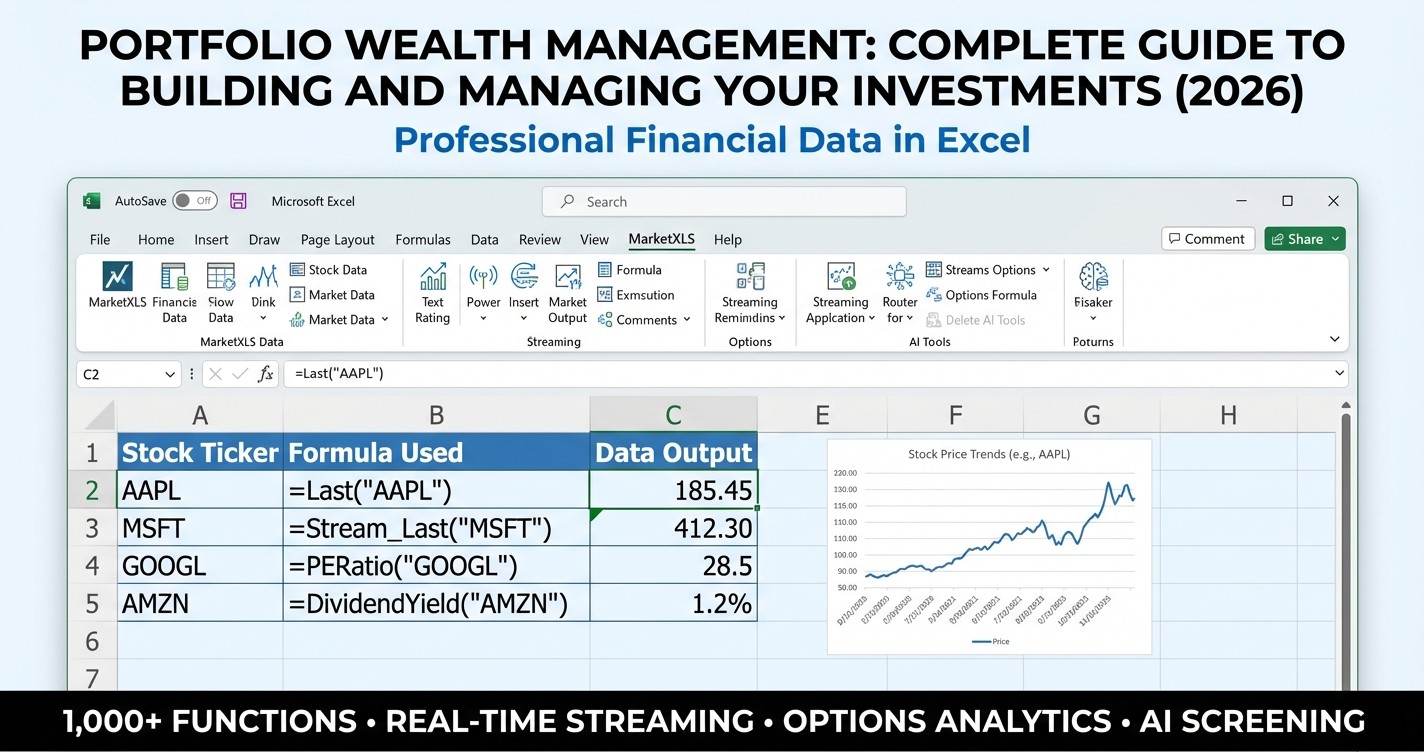
Portfolio wealth management - learn how to build, optimize, and manage diversified investment portfolios using data-driven strategies and Excel-based analytical tools in 2026.
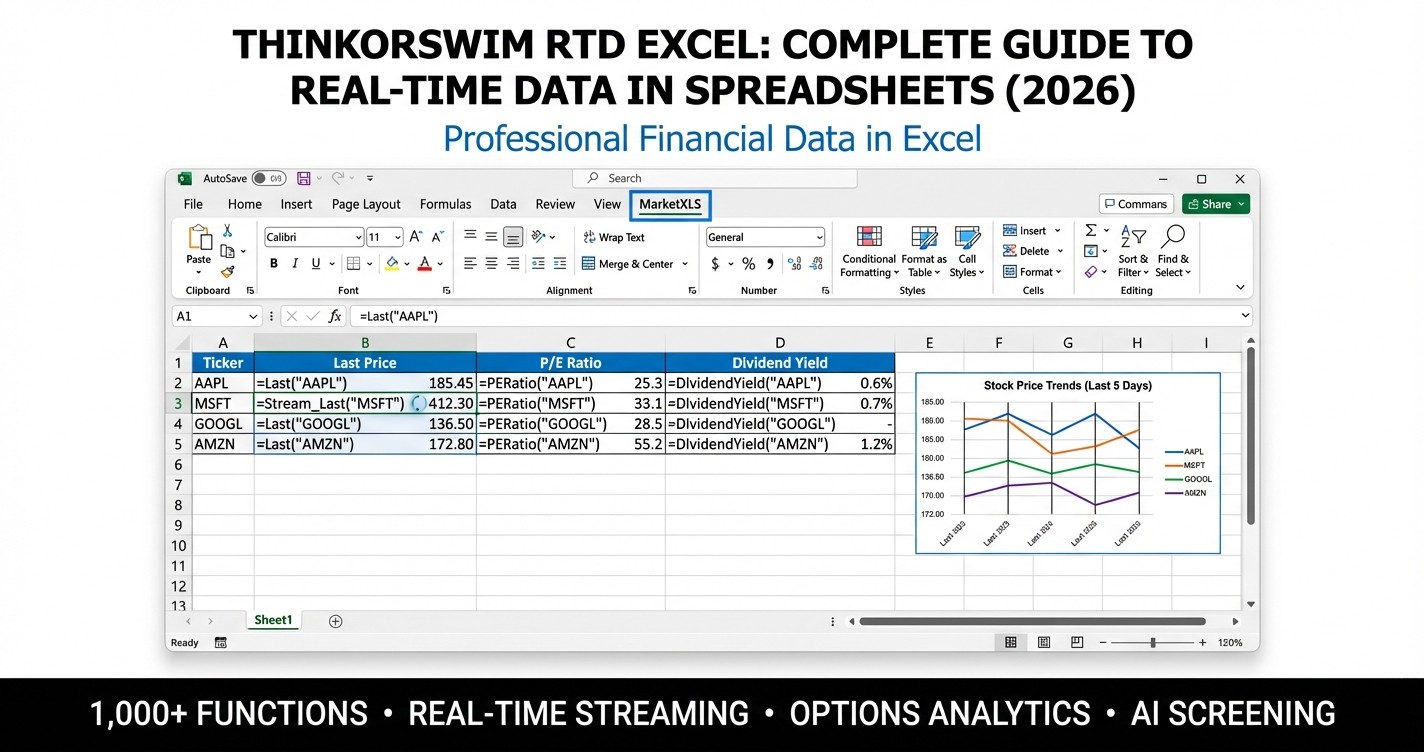
Thinkorswim RTD Excel - learn how to stream real-time market data into Excel using TOS RTD functions, compare RTD vs MarketXLS, and build powerful trading dashboards in 2026.
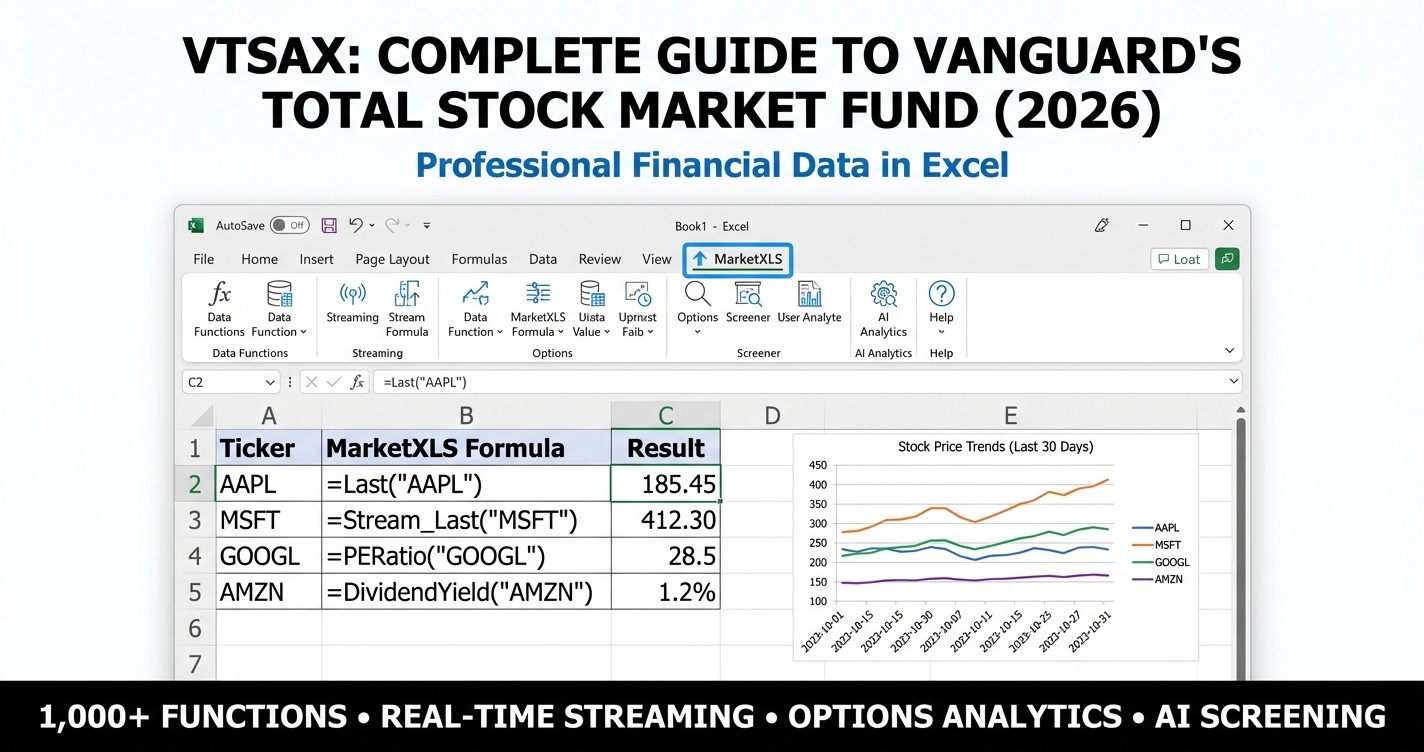
VTSAX - explore Vanguard's Total Stock Market Index Fund Admiral Shares, including performance analysis, dividend tracking, comparison with alternatives, and how to analyze it in Excel with MarketXLS in 2026.
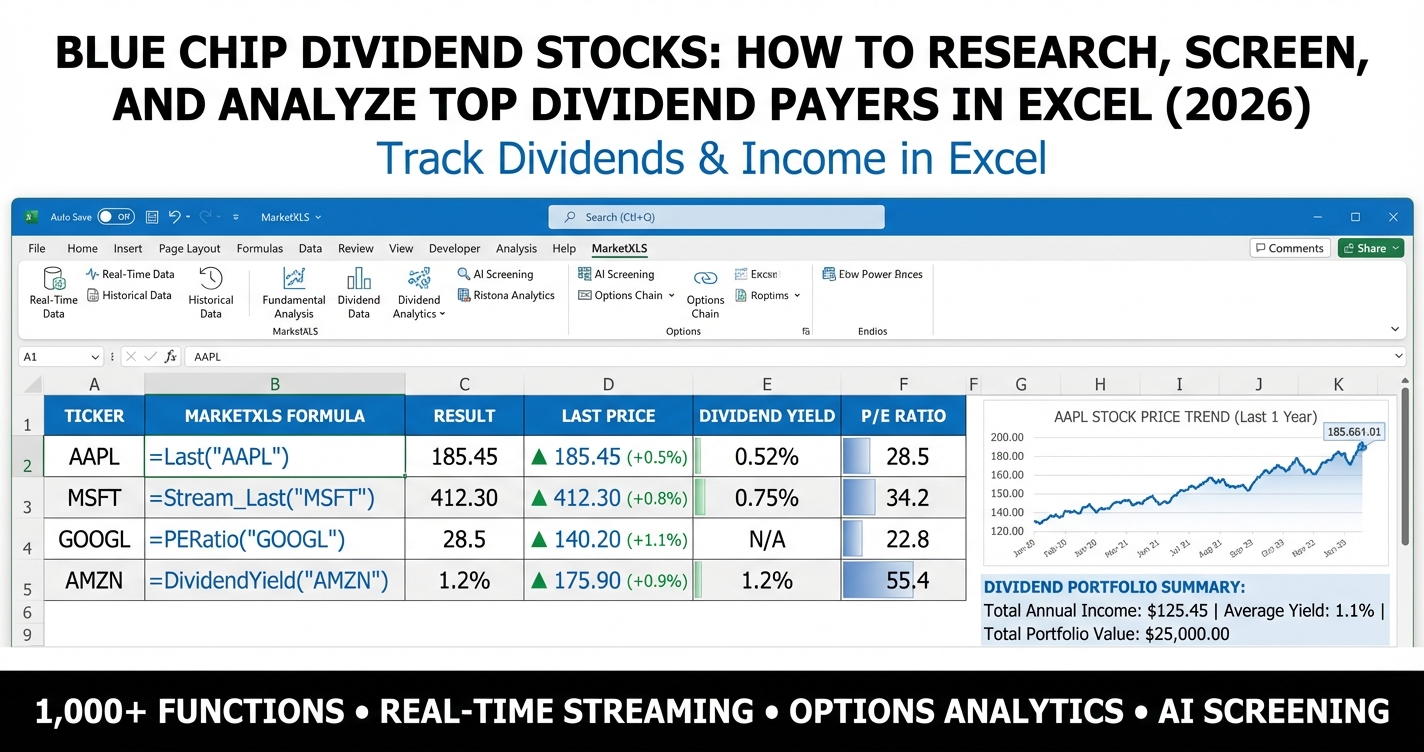
Blue chip dividend stocks - learn how to research, screen, and analyze top dividend-paying blue chip companies using Excel and MarketXLS in 2026. Covers dividend yield analysis, payout ratios, screening criteria, and portfolio construction strategies.
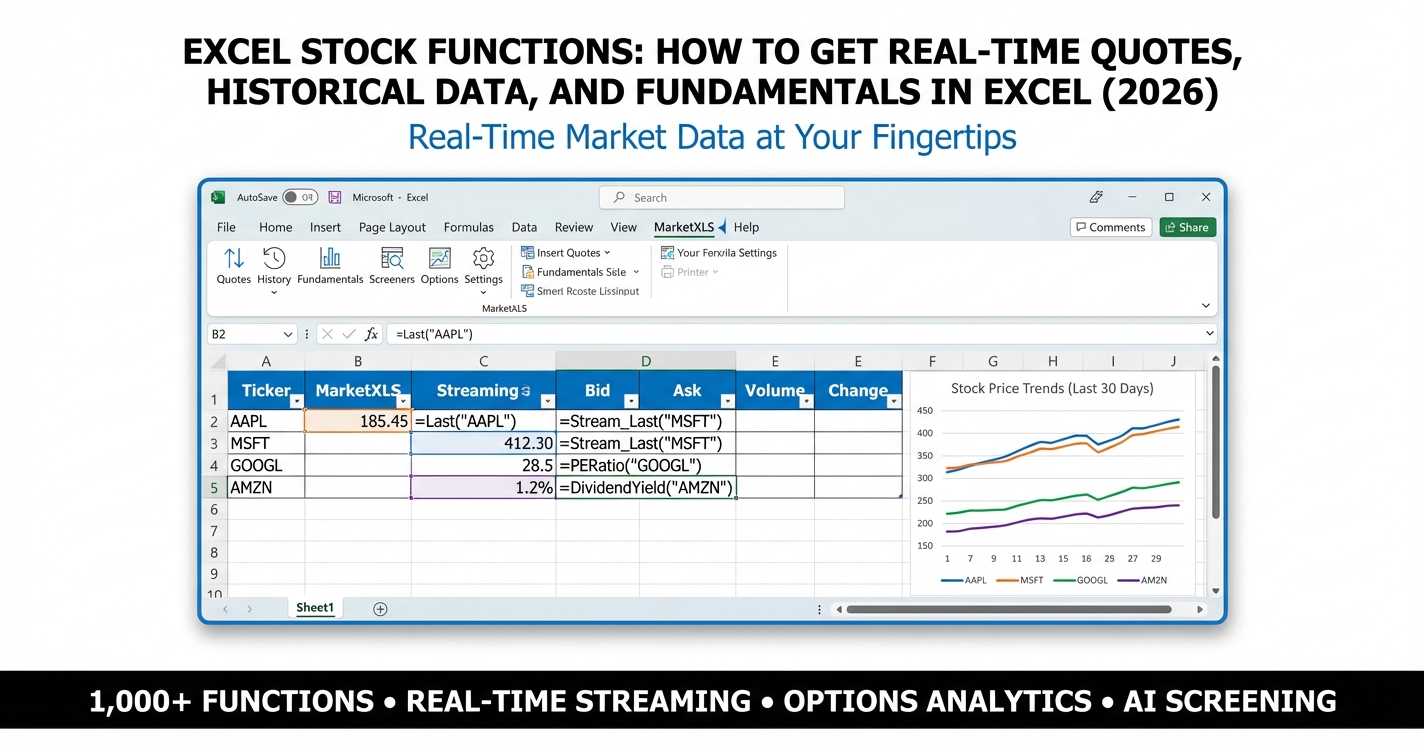
Excel stock functions - learn every method to get real-time stock quotes, historical prices, and fundamental data in Excel in 2026. Covers built-in STOCK data type, STOCKHISTORY, Power Query, and MarketXLS add-in formulas.
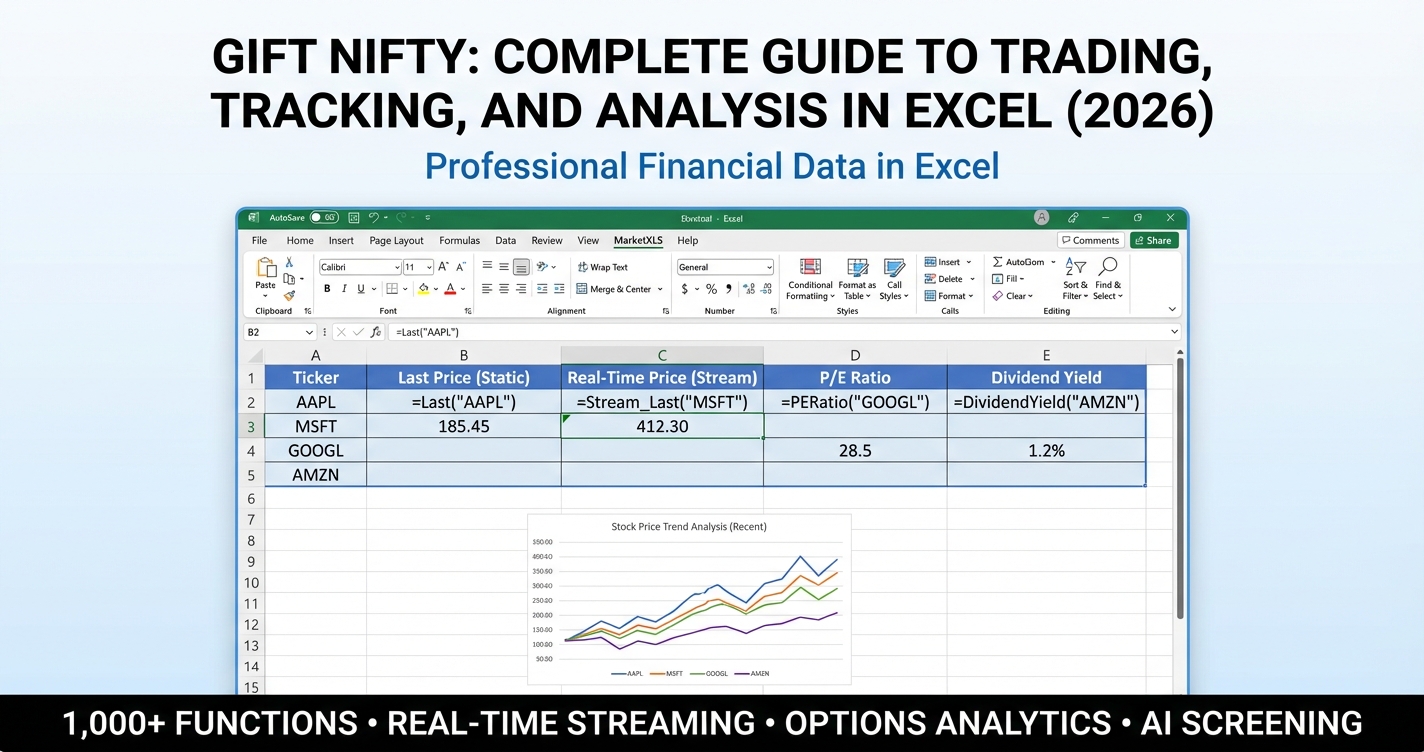
Gift Nifty - learn how to track, analyze, and understand the Gift Nifty index futures in 2026. Covers trading hours, differences from Nifty 50, gap analysis, ADR tracking, and Excel analysis with MarketXLS.
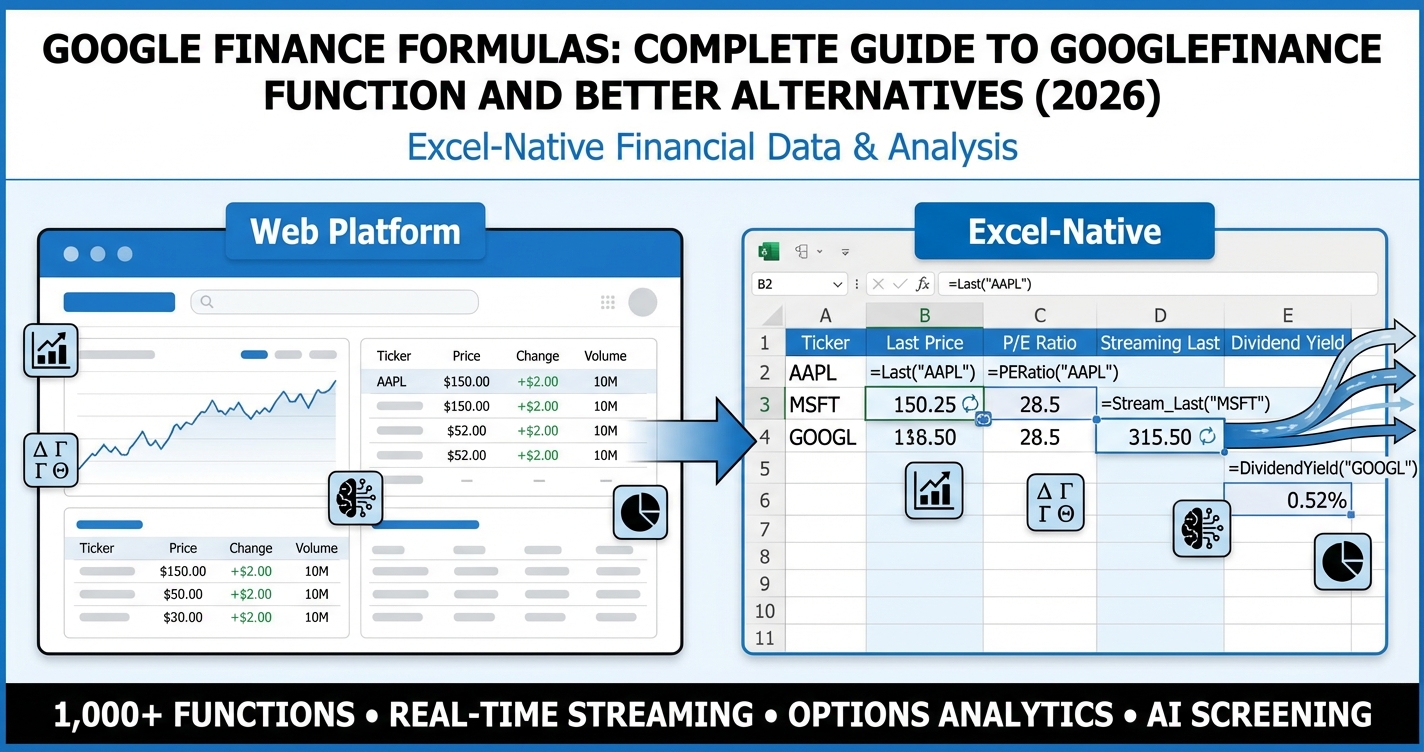
Google finance formulas - learn every GOOGLEFINANCE attribute, syntax, and limitation in 2026. Discover why MarketXLS with 1,000+ functions is the professional upgrade for Google Sheets and Excel users.
Excel stock tracker - build a complete portfolio dashboard with real-time prices, fundamentals, dividends, technical indicators, and performance analytics using MarketXLS formulas directly in your spreadsheet.
Google Finance API - the original API was deprecated in 2012, but the GOOGLEFINANCE function in Google Sheets still works for basic stock data. This guide covers its limitations and professional alternatives for Excel and Sheets.
Yahoo Finance API - the complete guide covering availability in 2026, rate limits, Python integration with yfinance, Excel alternatives, and why MarketXLS delivers more reliable financial data directly in your spreadsheet.
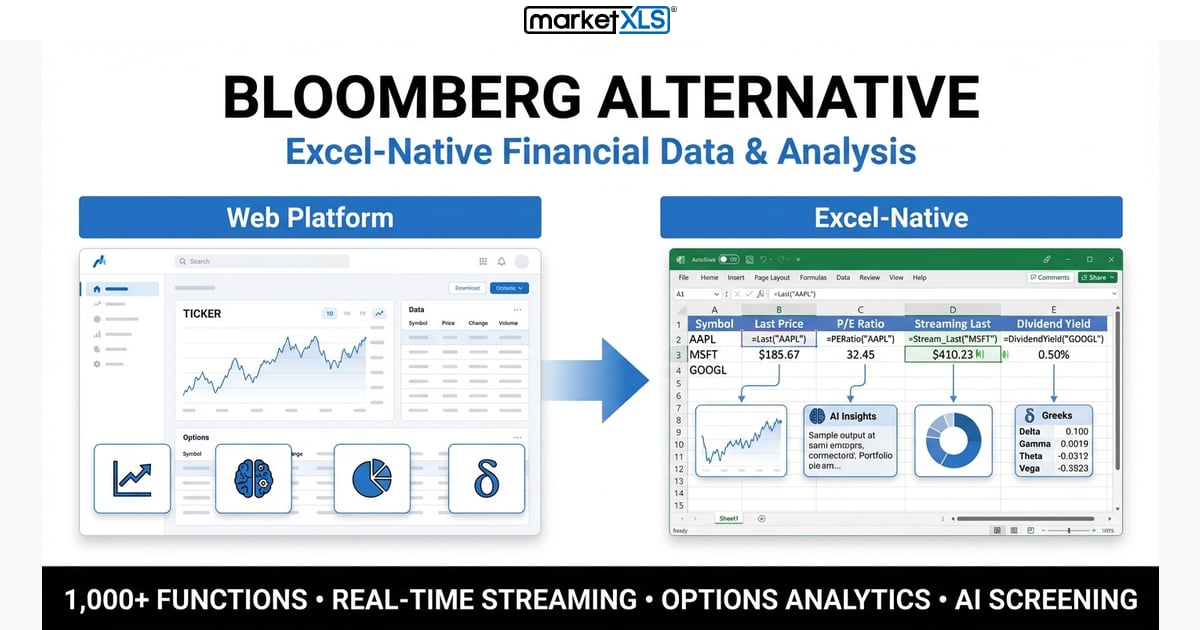
Bloomberg alternative - compare Bloomberg Terminal to MarketXLS, the Excel-native financial data platform that delivers real-time quotes, options chains, fundamentals, and technical indicators at a fraction of the cost.
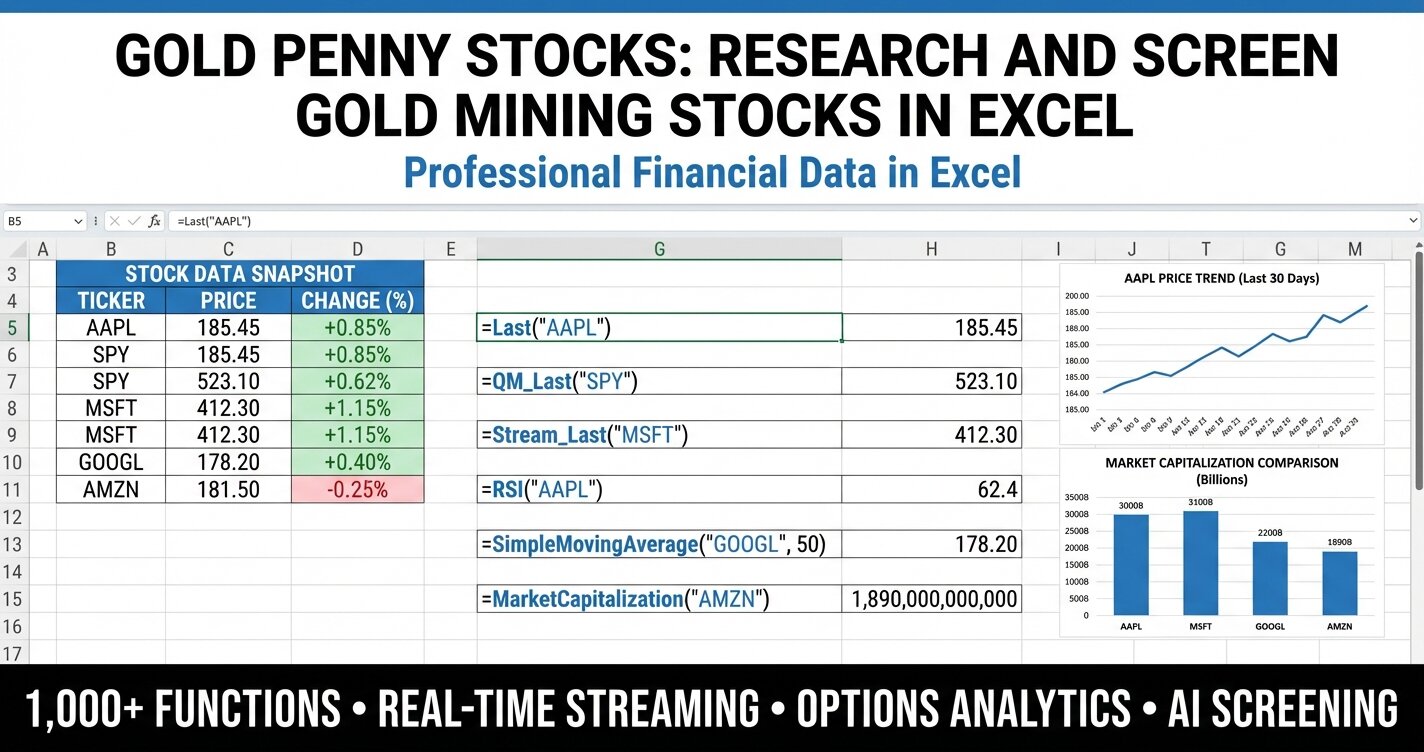
Gold Penny Stocks - learn how to research, screen, and analyze gold mining penny stocks using Excel and MarketXLS in 2026. Covers screening criteria, risk analysis, fundamental data tools, and portfolio allocation strategies for small-cap gold miners.
Discover how 2,500+ serious investors are saving 15+ hours every week with real-time market data directly in Excel.
✓ No credit card required • ✓ 14-day money-back guarantee • ✓ Cancel anytime