

To find the dividend yield for a stock in Google Sheets or Excel, install the MarketXLS add-on (Google Sheets) or add-in (Excel) and type =DividendYield("AAPL"). The function returns the trailing twelve-month dividend yield as a decimal (0.0052 means 0.52%), so format the cell as a percentage. Dividend yield is annual dividends per share divided by the current share price, and it tells you how much cash income each dollar invested would have paid over the past year.
Try it in your own spreadsheet
Get the free MarketXLS sample workbook (.xlsx).
No account needed. MarketXLS live data requires a paid plan.
Explore more videos
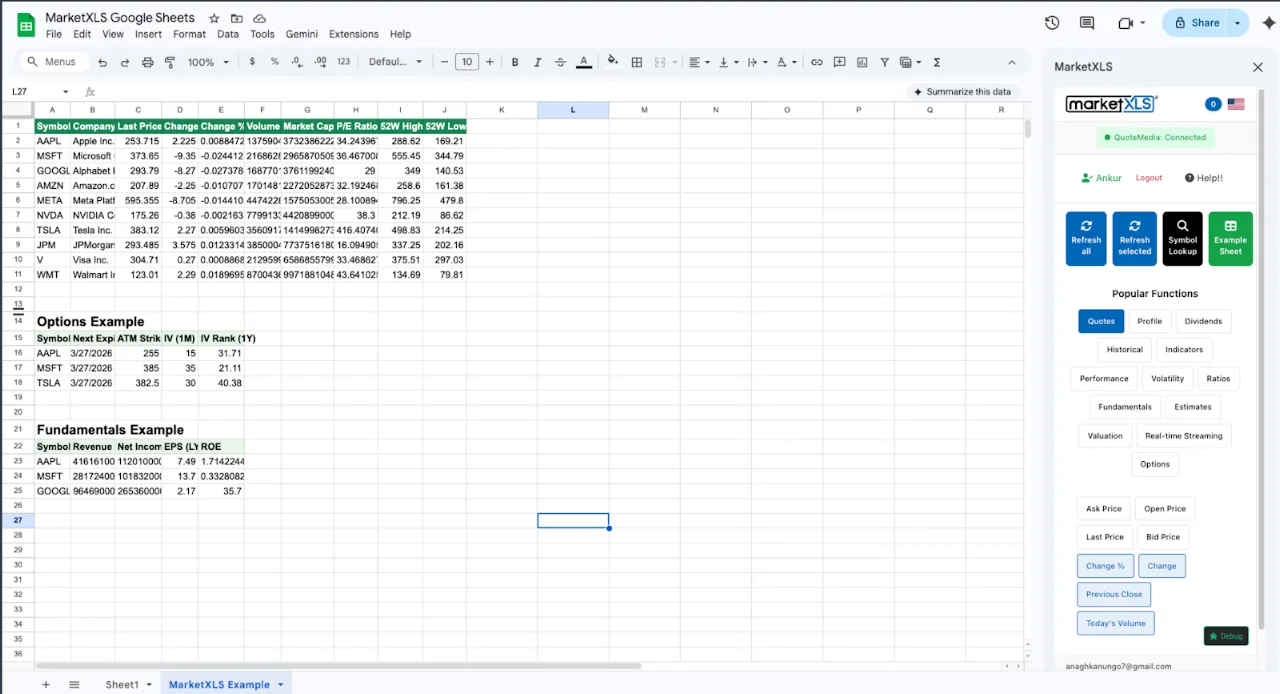
This guide covers the formula, how to calculate yield by hand, the related MarketXLS dividend functions, typical yield ranges by sector, how to screen for high-yield stocks, and the yield traps to watch for.
What Is Dividend Yield?
Dividend yield is a financial ratio that measures the annual dividend income relative to the current stock price. The formula is straightforward:
Dividend Yield = (Annual Dividends Per Share ÷ Current Stock Price) × 100
For example, if a company pays $4.00 per share in annual dividends and its stock trades at $100, the dividend yield is 4.0%.
Dividend yield is expressed as a percentage and provides a quick way to compare the income-generating potential of different stocks. A stock with a 5% yield pays more income per dollar invested than a stock with a 2% yield, all else being equal.
Key Points About Dividend Yield
| Aspect | Detail |
|---|---|
| Formula | Annual Dividends Per Share ÷ Current Price × 100 |
| Expressed As | Percentage (%) |
| Frequency | Typically calculated on trailing 12-month dividends |
| Dynamic | Changes daily as the stock price fluctuates |
| Inverse Relationship | Yield rises when stock price falls (and vice versa) |
| Not Guaranteed | Companies can cut or suspend dividends at any time |
The Inverse Relationship Between Yield and Price
Dividend yield rises when the stock price falls, even if the dividend has not changed, because yield is dividends divided by price.
This means a very high dividend yield can sometimes be a warning sign rather than a buying opportunity. If a stock's yield suddenly jumps from 3% to 8%, it might be because the stock price has collapsed due to deteriorating business fundamentals, and the dividend may soon be cut. This is known as a yield trap.
How to Calculate Dividend Yield Manually
To calculate dividend yield yourself, you need two pieces of information:
- Annual dividends per share: the total dividends paid per share over the past 12 months (or the forward annual dividend if declared)
- Current stock price: the most recent trading price
Example Calculation
Suppose Company XYZ:
- Paid quarterly dividends of $0.75 per share (four payments in the last year)
- Annual dividend = $0.75 × 4 = $3.00
- Current stock price = $60.00
Dividend Yield = ($3.00 ÷ $60.00) × 100 = 5.0%
Trailing vs. Forward Dividend Yield
- Trailing dividend yield uses dividends actually paid over the past 12 months divided by the current price. This is backward-looking and factual.
- Forward dividend yield uses the declared or expected annual dividend divided by the current price. This is forward-looking and may not materialize if the company changes its dividend policy.
MarketXLS =DividendYield() returns the trailing yield. For forward yield, use =ForwardAnnualDividendYield("AAPL").
Calculating Dividend Yield in Excel With MarketXLS
MarketXLS has dedicated dividend functions, so each dividend field is one formula per stock. On Mac or Excel for the web (the Microsoft 365 add-in), prefix the functions with mxls., for example =mxls.DividendYield("AAPL").
The =DividendYield() Function
=DividendYield() returns a stock's trailing dividend yield:
=DividendYield("AAPL")
Formula documentation: DividendYield
This returns Apple's trailing twelve-month dividend yield as a decimal. Format the cell as a percentage, or multiply by 100.
The =DividendPerShare() Function
=DividendPerShare() returns the dollar amount of dividends paid per share:
=DividendPerShare("AAPL")
Formula documentation: DividendPerShare
This returns the trailing twelve-month dividend per share, which you can use to estimate income or check the yield.
The =DividendFrequency() Function
=DividendFrequency() returns how often a company pays dividends:
=DividendFrequency("AAPL")
Formula documentation: DividendFrequency
It returns a text value such as Quarterly, Monthly, Semi-Annual, Annual, or Irregular. Most U.S. companies pay quarterly, but some REITs and Canadian companies pay monthly.
The =Last() Function
=Last() returns the current stock price for manual yield calculations:
=Last("AAPL")
Formula documentation: Last
Building a Complete Dividend Dashboard
Here is a practical Excel layout for analyzing dividend yield across multiple stocks:
| Row | A (Ticker) | B (Price) | C (Div Yield) | D (Div/Share) | E (Frequency) | F (Annual Income per 100 shares) |
|---|---|---|---|---|---|---|
| 1 | AAPL | =Last("AAPL") | =DividendYield("AAPL") | =DividendPerShare("AAPL") | =DividendFrequency("AAPL") | =D1*100 |
| 2 | MSFT | =Last("MSFT") | =DividendYield("MSFT") | =DividendPerShare("MSFT") | =DividendFrequency("MSFT") | =D2*100 |
| 3 | JNJ | =Last("JNJ") | =DividendYield("JNJ") | =DividendPerShare("JNJ") | =DividendFrequency("JNJ") | =D3*100 |
| 4 | KO | =Last("KO") | =DividendYield("KO") | =DividendPerShare("KO") | =DividendFrequency("KO") | =D4*100 |
| 5 | PG | =Last("PG") | =DividendYield("PG") | =DividendPerShare("PG") | =DividendFrequency("PG") | =D5*100 |
This dashboard shows dividend income across your holdings and refreshes when the sheet recalculates. Prices are 15-minute delayed on the Standard plan and real-time on Advanced and Business.
Using Dividend Yield in Google Sheets
MarketXLS works as a Google Sheets add-on, and the dividend functions use the same names as in Excel:
=DividendYield("MSFT")
=DividendPerShare("MSFT")
=Ex_DividendDate("MSFT")
=PayoutRatio("MSFT")
=Last("MSFT")
Formula documentation: DividendYield, DividendPerShare, Ex_DividendDate, PayoutRatio, Last
Install the MarketXLS add-on from the Google Workspace Marketplace, open a sheet, and type the formula in any cell. Google Sheets is useful for sharing a dividend dashboard with clients or colleagues. Google Sheets uses the same pricing as the regular MarketXLS plans. Some functions differ by platform, so check /formulas before relying on a less common one. Learn more on the MarketXLS for Google Sheets page.
What Is a "Good" Dividend Yield?
A good dividend yield depends on the sector, market conditions, and your goals, so compare a stock's yield with its sector rather than with a single number. The ranges below are general rules of thumb, not current data:
Dividend Yield Benchmarks by Category
| Category | Typical Yield Range | Notes |
|---|---|---|
| S&P 500 Average | 1.2% – 1.8% | Market benchmark |
| Blue-Chip Stocks | 2.0% – 3.5% | Established, stable companies |
| Utilities | 3.0% – 5.0% | Regulated, stable cash flows |
| REITs | 4.0% – 8.0% | Required to distribute 90% of taxable income |
| MLPs | 5.0% – 10.0% | Energy infrastructure, tax-advantaged |
| High-Yield Stocks | 5.0%+ | Higher risk, may include yield traps |
| Dividend Aristocrats | 2.0% – 4.0% | 25+ consecutive years of dividend increases |
| Growth Stocks | 0% – 1.0% | Reinvest earnings rather than pay dividends |
The Sweet Spot
Many income investors look for yields of roughly 2.5% to 5.0% from financially healthy companies: high enough to produce meaningful income but not so high that the yield itself signals a problem.
Screening for High-Yield Dividend Stocks
A dividend screen should filter on yield plus payout ratio, growth, and valuation, because sorting by yield alone surfaces yield traps.
Key Screening Criteria
- Dividend Yield: minimum 2.5% (or your target threshold)
- Dividend Per Share: confirm the actual dollar amount is meaningful
- Dividend Frequency: quarterly or monthly preferred for consistent income
- Payout Ratio: below 75% for most sectors (below 90% for REITs and utilities)
- Revenue Growth: positive revenue growth supports future dividend increases
- P/E Ratio: reasonable valuation relative to sector peers
- Market Capitalization: larger companies tend to have more stable dividends
Building a Dividend Screen in Excel With MarketXLS
A dividend screen in Excel is one row per ticker with these columns:
// Column A: Ticker symbols (enter your list)
// Column B: Current price
=Last("KO")

// Column C: Dividend yield
=DividendYield("KO")

// Column D: Dividend per share
=DividendPerShare("KO")

// Column E: Dividend frequency
=DividendFrequency("KO")

// Column F: P/E Ratio
=PERatio("KO")

// Column G: Market cap
=MarketCapitalization("KO")

// Column H: Revenue
=Revenue("KO")
Formula documentation: Last, DividendYield, DividendPerShare, DividendFrequency, PERatio, MarketCapitalization, Revenue
By entering a list of ticker symbols in Column A and dragging these formulas down, you can screen dozens or hundreds of stocks on the same criteria. Then use Excel's built-in sorting and filtering to identify the stocks that meet your criteria.
Interpreting Screen Results
When reviewing your dividend screen results:
- Very high yields (8%+): investigate carefully. The yield may be elevated because the stock price has dropped, and a dividend cut may be imminent.
- Yields below the sector average: may indicate a growth-oriented company that reinvests earnings rather than distributing them.
- Consistent dividend frequency: quarterly dividends are the norm for U.S. stocks. Monthly dividends are a bonus for income investors.
- Low P/E with high yield: could be a value opportunity or a value trap. Cross-reference with revenue and earnings trends.
Dividend Yield by Sector
Dividend yields differ widely by sector. The ranges below are general rules of thumb, not current data:
Sector Dividend Yield Comparison
| Sector | Average Yield | Dividend Characteristics |
|---|---|---|
| Technology | 0.5% – 1.5% | Lower yields, rapid earnings growth |
| Healthcare | 1.5% – 2.5% | Moderate yields, stable demand |
| Consumer Staples | 2.5% – 3.5% | Above-average yields, recession-resistant |
| Financials | 2.0% – 4.0% | Variable, sensitive to interest rates |
| Utilities | 3.0% – 5.0% | High yields, regulated earnings |
| Energy | 3.0% – 6.0% | Variable, tied to commodity prices |
| Real Estate (REITs) | 4.0% – 8.0% | Highest yields, legally required payouts |
| Industrials | 1.5% – 2.5% | Cyclical, moderate yields |
| Materials | 2.0% – 3.5% | Cyclical, commodity-dependent |
| Communication Services | 1.0% – 3.0% | Wide range, includes growth and value |
Understanding sector norms helps you evaluate whether a particular stock's yield is attractive or concerning relative to its peers.
Common Dividend Yield Traps and How to Avoid Them
Trap 1: The Falling Knife Yield
A stock drops from $100 to $50, and the yield doubles from 3% to 6%. The high yield looks attractive, but the stock price decline suggests the business is struggling, and the dividend may soon be cut.
How to avoid: Always check why the yield is high. Look at recent earnings, revenue trends, and news. A declining stock price without a corresponding business problem may be a genuine opportunity, but a declining stock price with deteriorating fundamentals is a trap.
Trap 2: The One-Time Special Dividend
Some companies pay large one-time special dividends that temporarily inflate the trailing yield. The yield returns to normal (much lower) after the special dividend period rolls off.
How to avoid: Check the dividend payment history. Look for consistency in regular quarterly or monthly payments rather than one-time spikes.
Trap 3: The Unsustainable Payout Ratio
A company paying out 120% of its earnings as dividends is borrowing or depleting reserves to maintain its dividend. This is not sustainable.
How to avoid: Calculate the payout ratio (Dividends Per Share ÷ Earnings Per Share). A payout ratio above 80% for most sectors, or above 95% for REITs and utilities, is a warning sign.
Trap 4: The Cyclical Dividend
Companies in cyclical industries (energy, mining, materials) may have high yields during the peak of the business cycle when earnings are strong. As the cycle turns, earnings drop and dividends are cut.
How to avoid: Look at dividend history across full business cycles (5–10 years). Companies that maintained dividends through downturns are more reliable.
Dividend Yield vs. Total Return
Dividend yield is only one component of total return. Total return includes:
Total Return = Price Appreciation + Dividend Income
A stock with a 2% dividend yield and 10% price appreciation delivers a 12% total return, higher than a stock with a 6% dividend yield and 0% price appreciation (6% total return).
Income investors should not focus exclusively on yield at the expense of total return. A balanced approach considers both income and capital growth.
Dividend Growth vs. High Current Yield
| Strategy | Focus | Typical Yield | Growth Potential |
|---|---|---|---|
| Dividend Growth | Companies that consistently raise dividends | 1.5% – 3.0% | High: yield on cost grows over time |
| High Current Yield | Companies with the highest current yield | 5.0% – 8.0% | Lower: yield may stagnate or decline |
| Blended Approach | Mix of growth and income stocks | 2.5% – 4.5% | Moderate: balanced income and growth |
Dividend growth investing aims to increase yield on cost over time as the dividend rises. Neither approach produces higher returns in every period. This is educational content, not investment advice.
Tax Considerations for Dividend Income
Dividend income is taxed differently depending on whether dividends are qualified or non-qualified:
- Qualified dividends: taxed at the long-term capital gains rate (0%, 15%, or 20% depending on income). Most dividends from U.S. companies held for more than 60 days qualify.
- Non-qualified (ordinary) dividends: taxed at your ordinary income tax rate, which can be significantly higher.
REIT dividends are generally taxed as ordinary income, which is one reason REIT yields are higher: investors demand a higher pre-tax yield to compensate for the less favorable tax treatment.
Note: Tax laws are complex and change frequently. Consult a qualified tax professional for advice specific to your situation.
Building a Dividend Income Portfolio in Excel
Here is a framework for building and tracking a dividend income portfolio using MarketXLS:
Portfolio Tracker Layout
// For each stock in your portfolio:
A1: Ticker (e.g., "JNJ")
B1: =Last("JNJ")                    // Current price
C1: =DividendYield("JNJ")           // Current yield
D1: =DividendPerShare("JNJ")        // Annual dividend per share
E1: =DividendFrequency("JNJ")       // Payment frequency
F1: 200                              // Shares owned (manual entry)
G1: =D1*F1                          // Annual dividend income
H1: =G1/12                          // Monthly dividend income
I1: =B1*F1                          // Position value
J1: =PERatio("JNJ")                 // Valuation check
Formula documentation: Last, DividendYield, DividendPerShare, DividendFrequency, PERatio
By building this for your entire portfolio, you can instantly see:
- Total annual dividend income across all holdings
- Monthly income estimates
- Portfolio-weighted average yield
- Diversification across sectors and payment frequencies
Frequently Asked Questions
What is dividend yield and how is it calculated?
Dividend yield is a financial ratio that expresses annual dividend payments as a percentage of the current stock price. The formula is: Annual Dividends Per Share ÷ Current Stock Price × 100. For example, a stock paying $2 in annual dividends with a price of $50 has a 4% dividend yield. In Excel, MarketXLS calculates this automatically with =DividendYield("TICKER").
What is a good dividend yield for income investing?
A good dividend yield depends on the sector and your risk tolerance. Generally, yields between 2.5% and 5.0% from financially stable companies represent a healthy balance between income and safety. Yields above 6–8% should be investigated carefully, as they may signal business distress or an unsustainable payout ratio.
How often do companies pay dividends?
Most U.S. companies pay dividends quarterly (four times per year). Some REITs and Canadian companies pay monthly. A smaller number pay semi-annually or annually. You can check any stock's payment schedule using =DividendFrequency("TICKER") in MarketXLS.
Why does dividend yield go up when a stock price falls?
Dividend yield is calculated by dividing the annual dividend by the stock price. When the stock price decreases and the dividend stays the same, the ratio (yield) increases. This is a mathematical relationship, not necessarily a positive signal. A rising yield due to a falling stock price may indicate business problems.
Can I screen for high-yield dividend stocks in Excel?
Yes. Using MarketXLS, you can enter a list of ticker symbols and use functions like =DividendYield(), =DividendPerShare(), =DividendFrequency(), =PERatio(), and =MarketCapitalization() to build a complete screening spreadsheet. Then use Excel's sort and filter features to identify stocks meeting your yield criteria.
What is the difference between dividend yield and dividend per share?
Dividend yield is a percentage that shows the return relative to the stock price. Dividend per share is the actual dollar amount paid per share annually. A stock at $200 paying $4 per share has a 2% yield, while a stock at $40 paying $2 per share has a 5% yield. The second stock has a higher yield despite paying fewer dollars per share.
Getting Started With Dividend Analysis in MarketXLS
MarketXLS adds dividend functions to Excel and Google Sheets. With functions like =DividendYield(), =DividendPerShare(), =DividendFrequency(), and =Last(), you can build custom screening tools, portfolio trackers, and income calculators tailored to your investment strategy.
See the full function list at MarketXLS formulas and plans on the pricing page.
Conclusion
Dividend yield is a core metric for income investors, but sorting by yield alone is not enough. Check the payout ratio, the reason behind a high yield, and the dividend history, and keep the data in a spreadsheet that refreshes. In Google Sheets or Excel, =DividendYield(), =DividendPerShare(), and =DividendFrequency() cover the basics.
Disclaimer
None of the content published on marketxls.com constitutes a recommendation that any particular security, portfolio of securities, transaction, or investment strategy is suitable for any specific person. The author is not offering any professional advice of any kind. The reader should consult a professional financial advisor to determine their suitability for any strategies discussed herein. The article is written to help users collect the required information from various sources deemed to be an authority in their content. The trademarks, if any, are the property of their owners, and no representations are made.
