
Portfolio & Investment Strategies
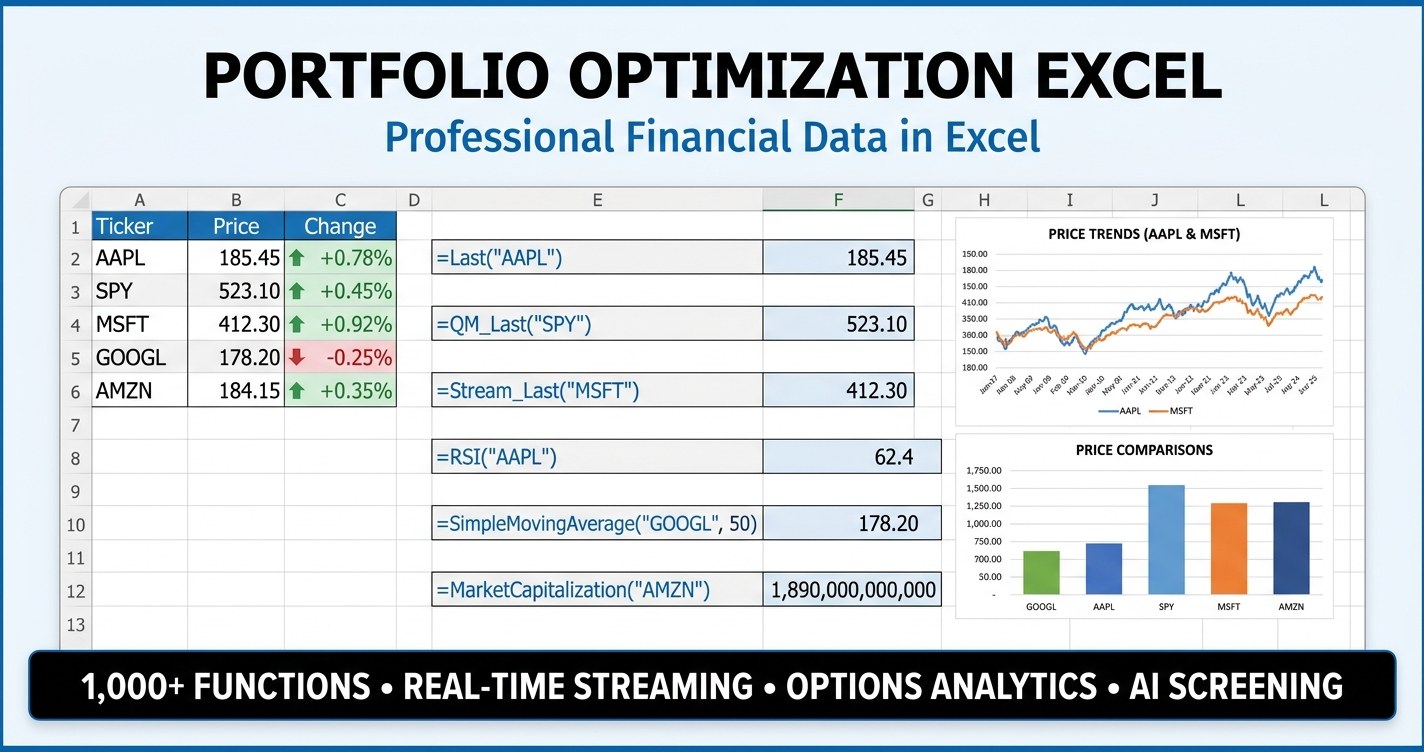
Set Excel Solver to maximize the Sharpe ratio cell by changing the weight cells, with long-only, fully invested, and weight-cap constraints. Template included.
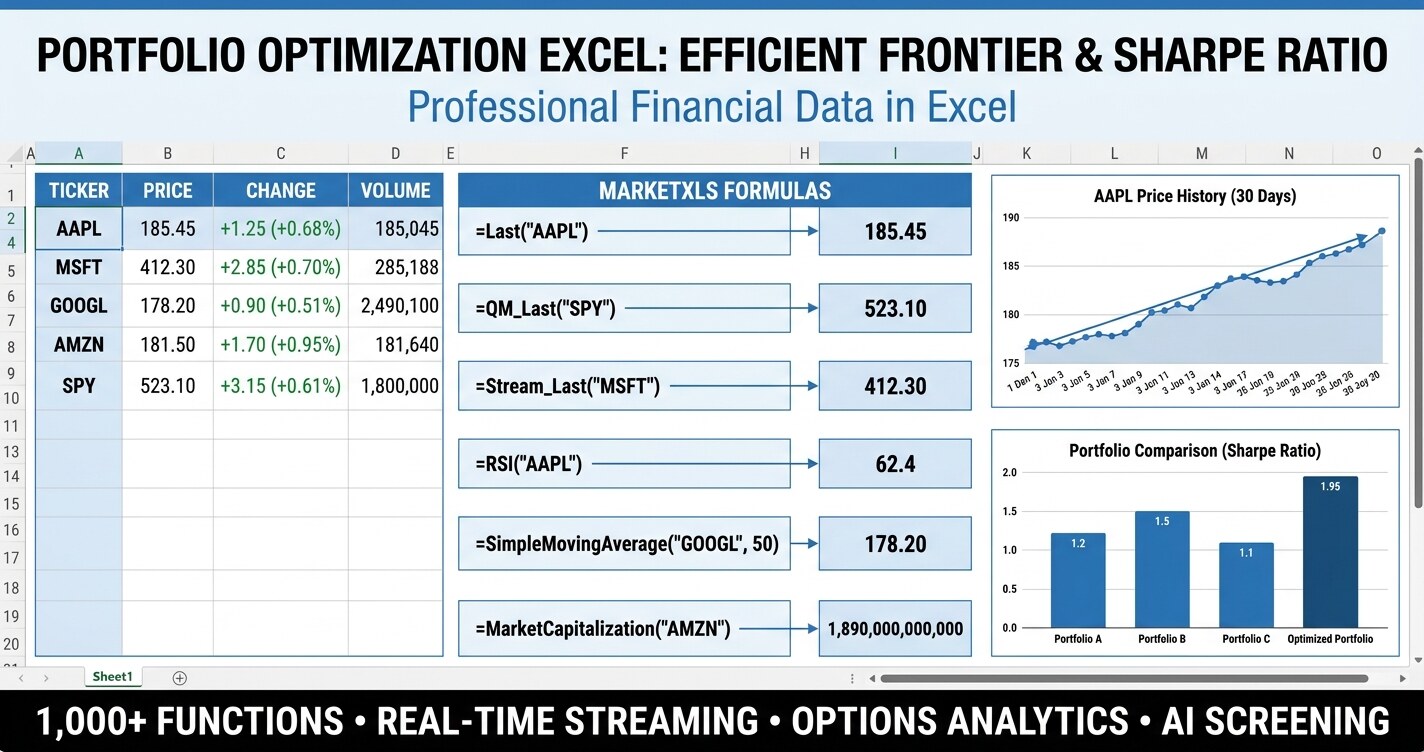
A step-by-step Excel portfolio optimization model: per-asset return and volatility, a correlation matrix, portfolio volatility, Sharpe ratio, and an efficient frontier.
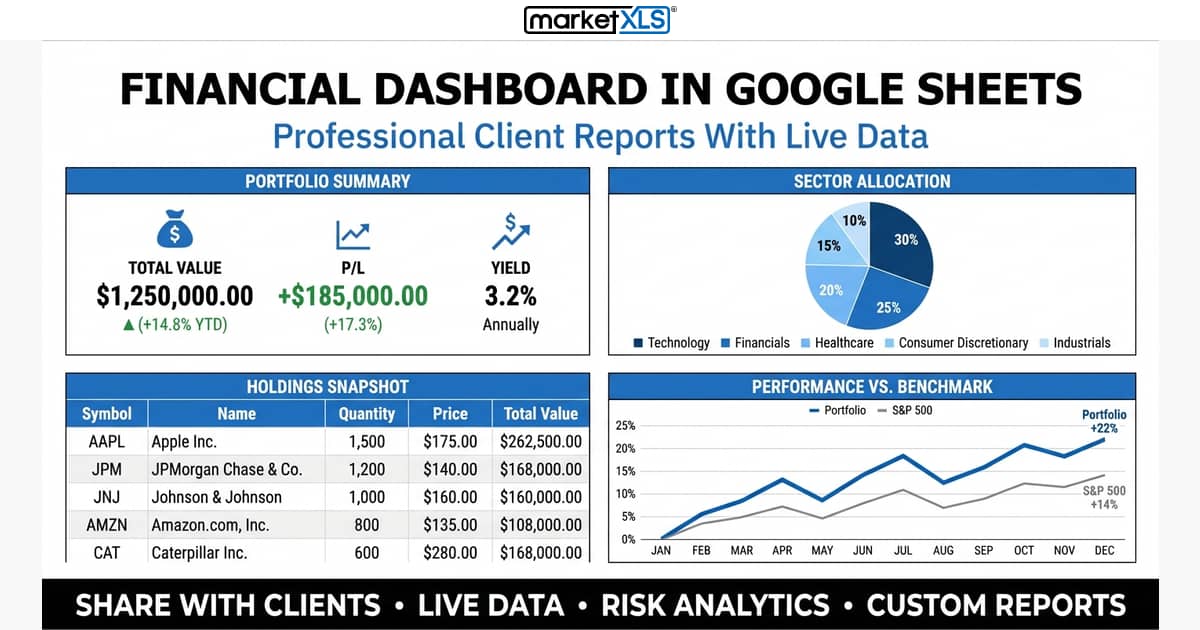
Build a professional financial dashboard in Google Sheets with MarketXLS. Create client-facing reports with live stock prices, portfolio performance, risk analytics, dividend tracking, and fundamental data.
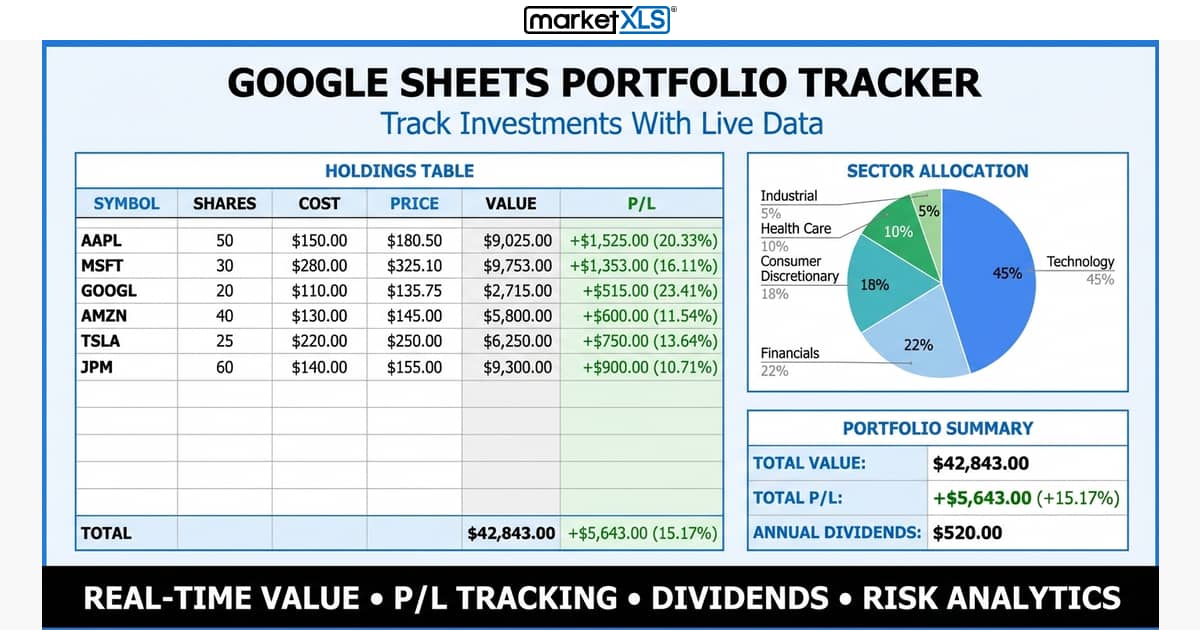
How to build a portfolio tracker in Google Sheets: holdings, P/L, dividend income, fundamentals, allocation and risk columns using MarketXLS formulas.
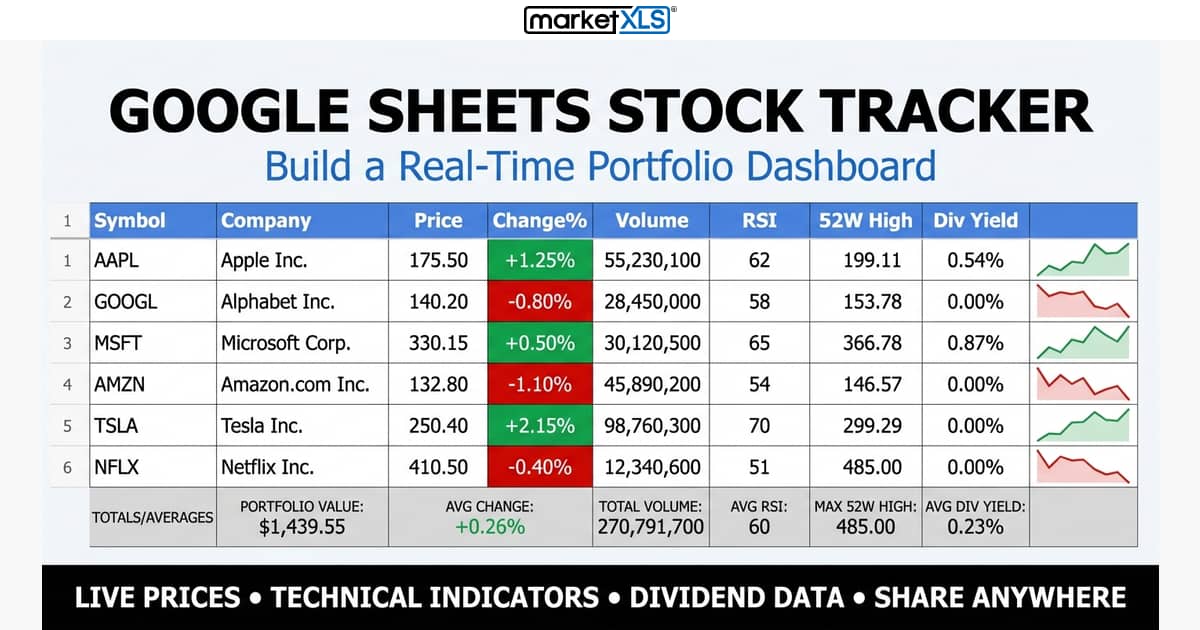
Build a stock tracker in Google Sheets with MarketXLS: one ticker per row, =Last(A2) for price, plus P/E, dividend yield, RSI, moving averages, and fundamentals.
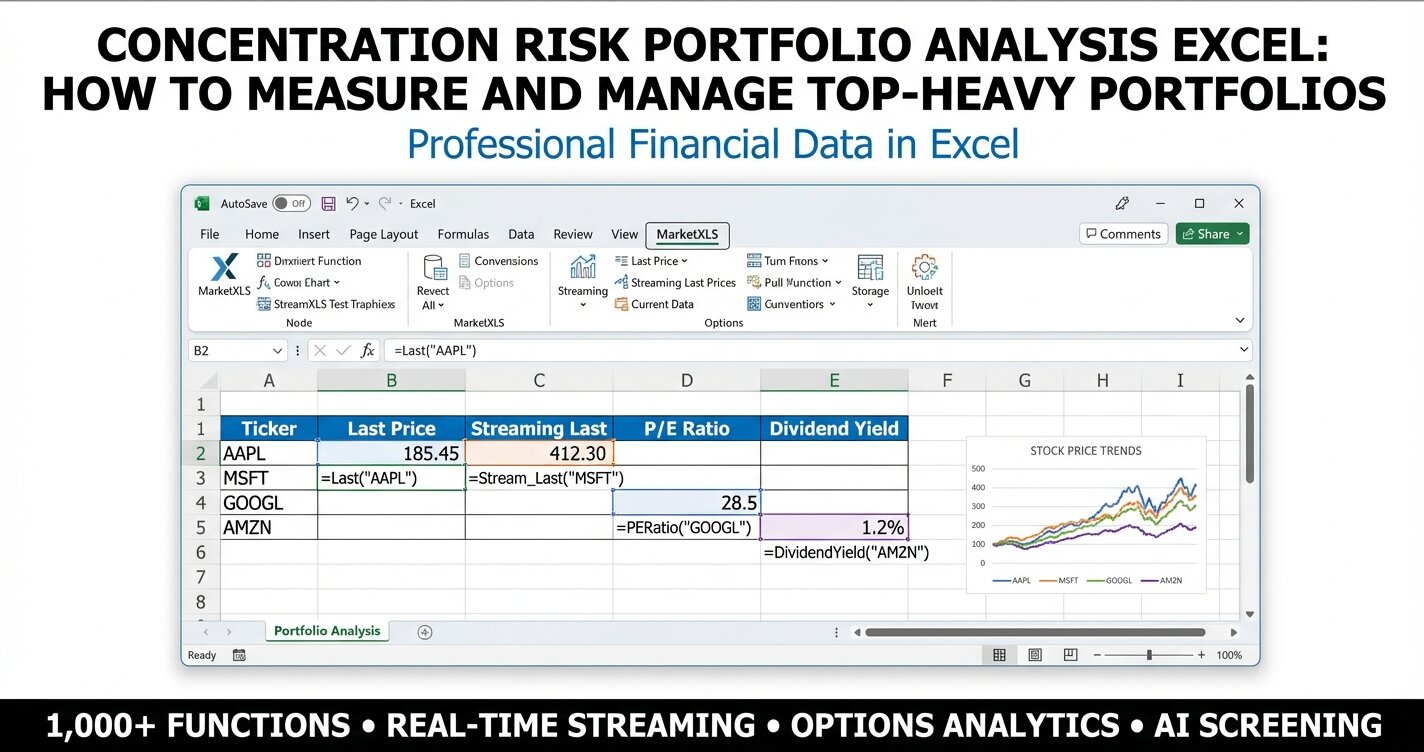
Concentration risk portfolio analysis excel — learn how to measure, monitor, and manage top-heavy portfolio exposure using the Herfindahl-Hirschman Index, sector overlap analysis, and rebalancing strategies, all built in Excel with MarketXLS formulas.
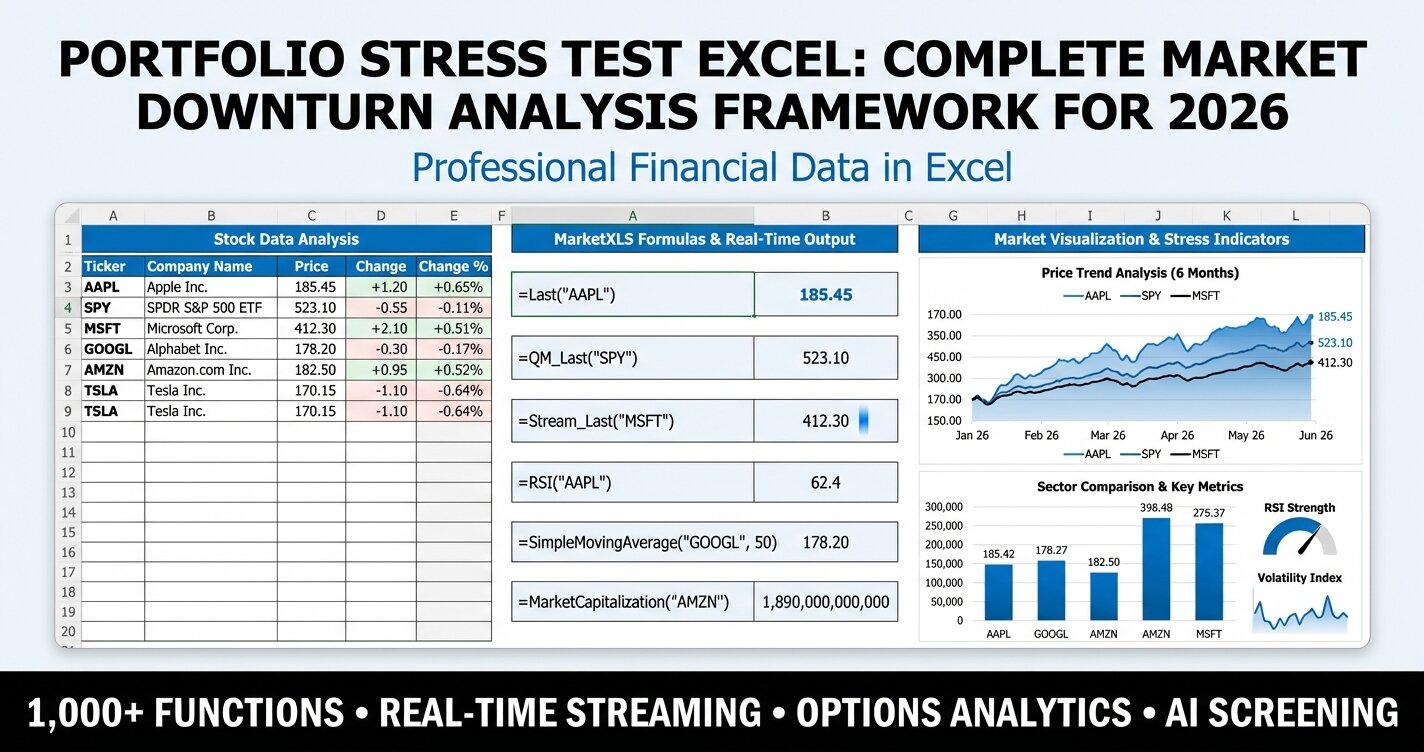
How to stress test a portfolio in Excel using beta-weighted market decline scenarios, drawdown tracking, and balance-sheet risk metrics.
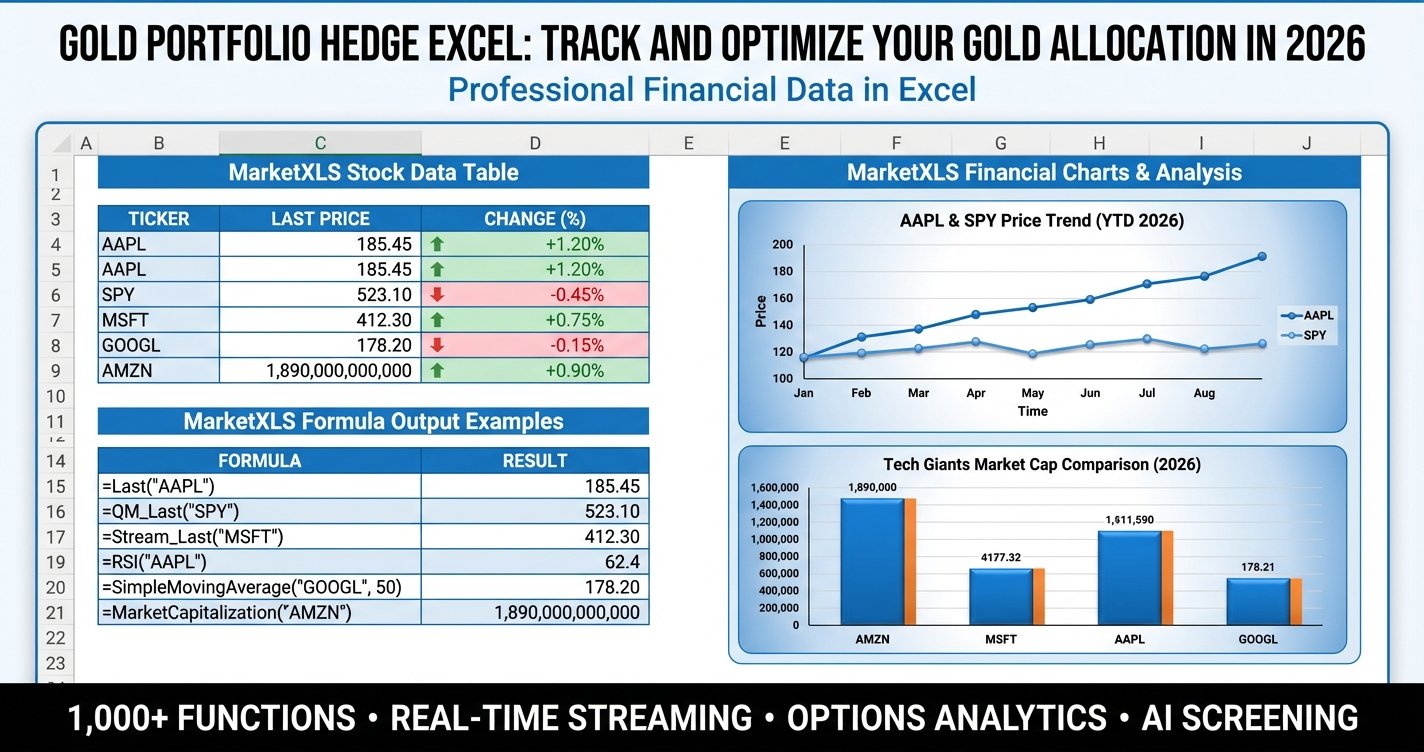
A free Excel gold hedge tracker comparing GLD, IAU, GDX, and gold miners, with allocation sizing, gold price scenarios, and a correlation matrix built on MarketXLS formulas.
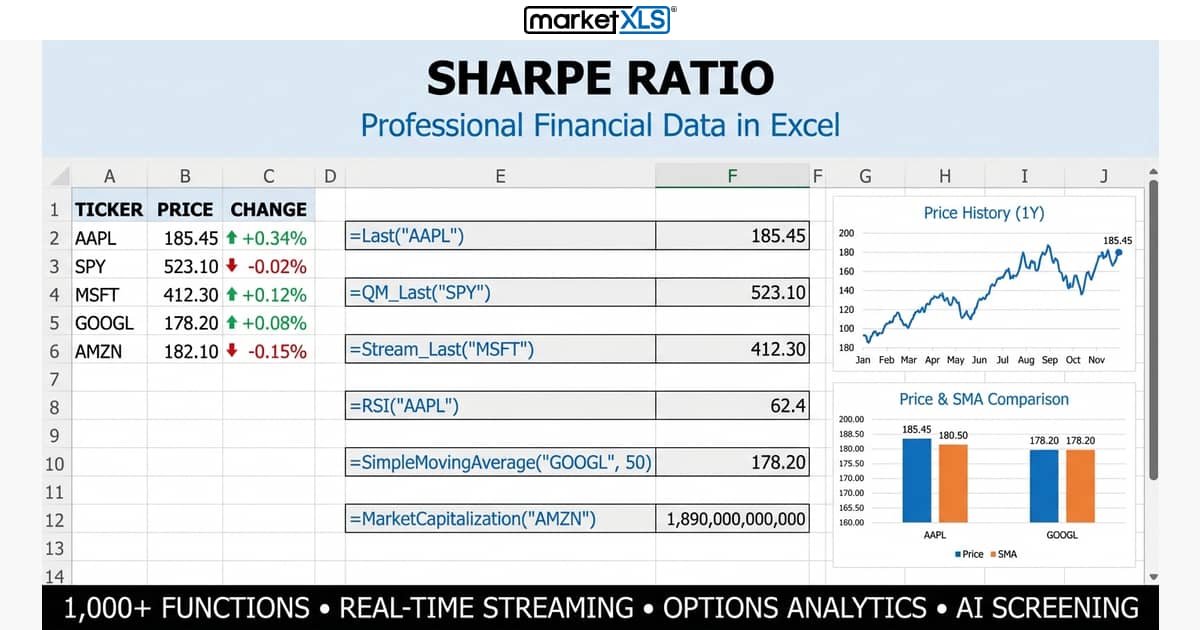
Portfolio Sharpe Ratio = (return minus risk-free rate) / standard deviation. How to calculate and annualize it in Excel, interpret it, and compare it with Sortino and Treynor.
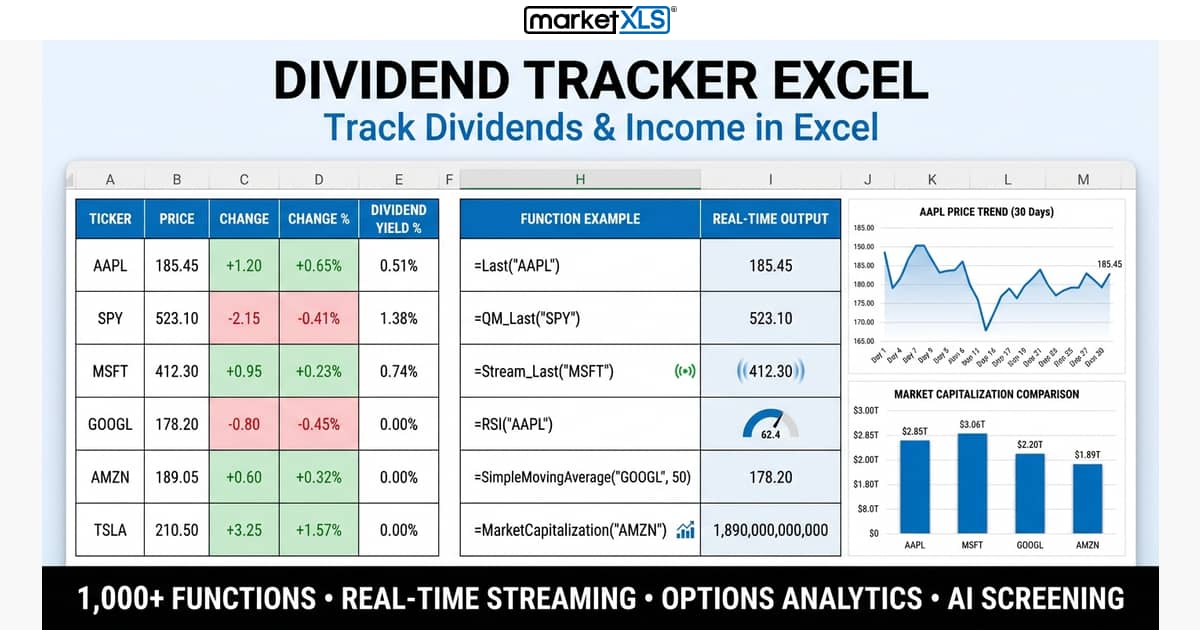
Build a self-updating dividend tracker in Excel: formulas for yield, dividend per share, payment frequency, and projected annual income, compared with manual and Google Sheets methods.
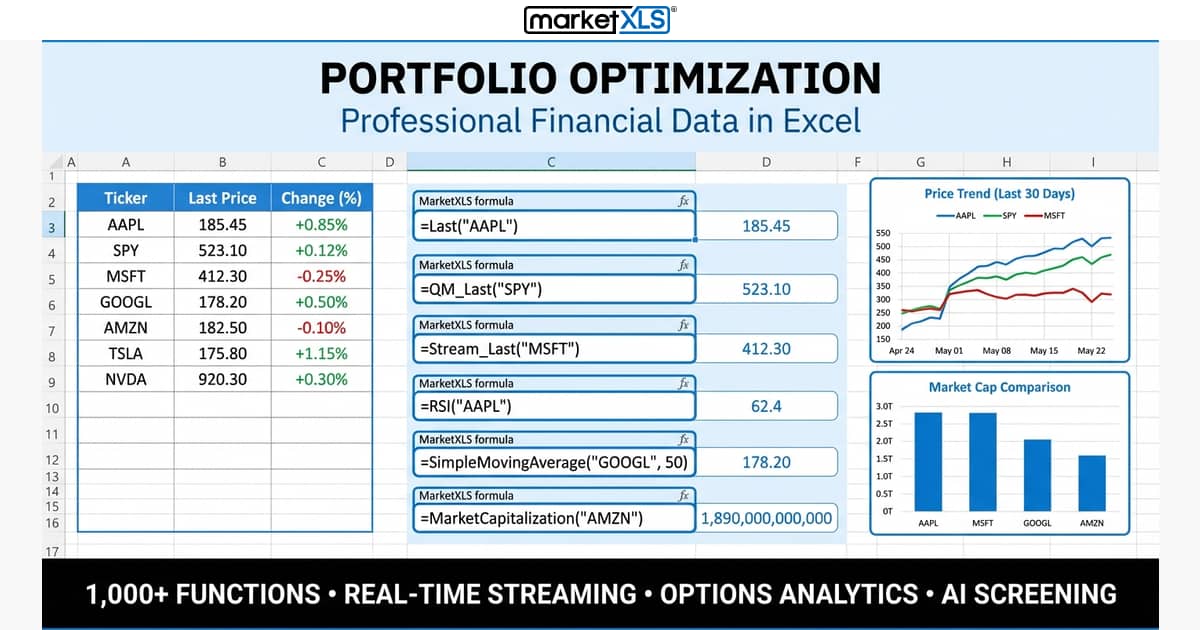
Black-Litterman, risk parity, factor, and AI portfolio optimization compared, with an Excel workflow using MarketXLS data and the FundXLS Portfolio X-Ray.
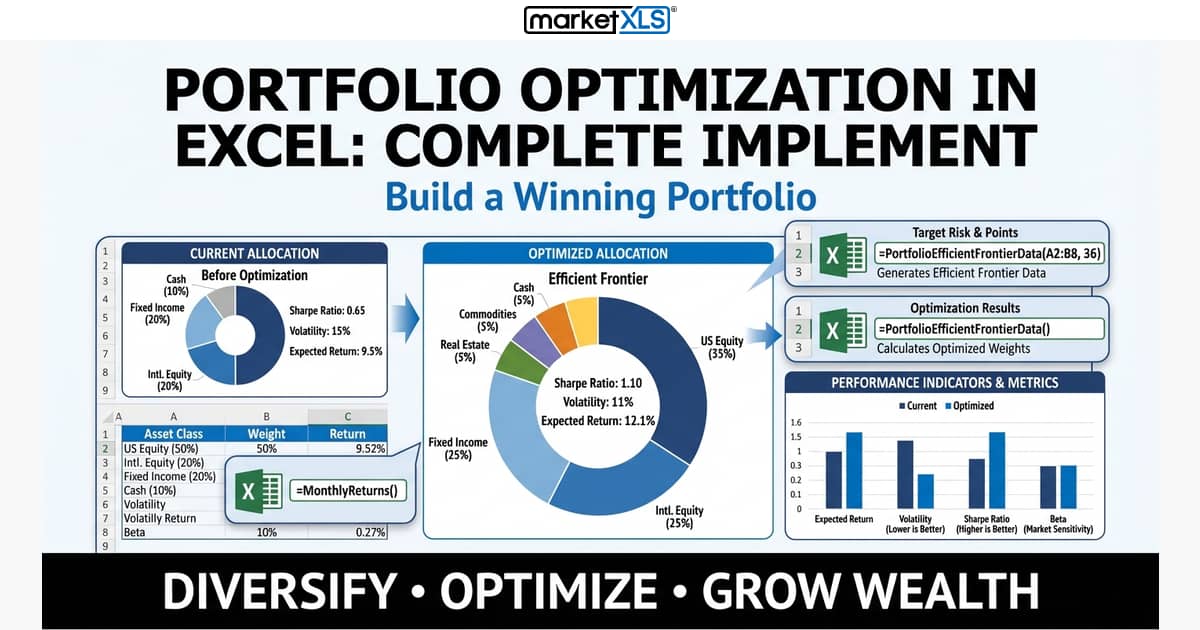
How to run portfolio optimization in Excel with MarketXLS functions: portfolio volatility, beta, Sharpe, Sortino, drawdown, VaR and efficient frontier from a ticker and weight range.
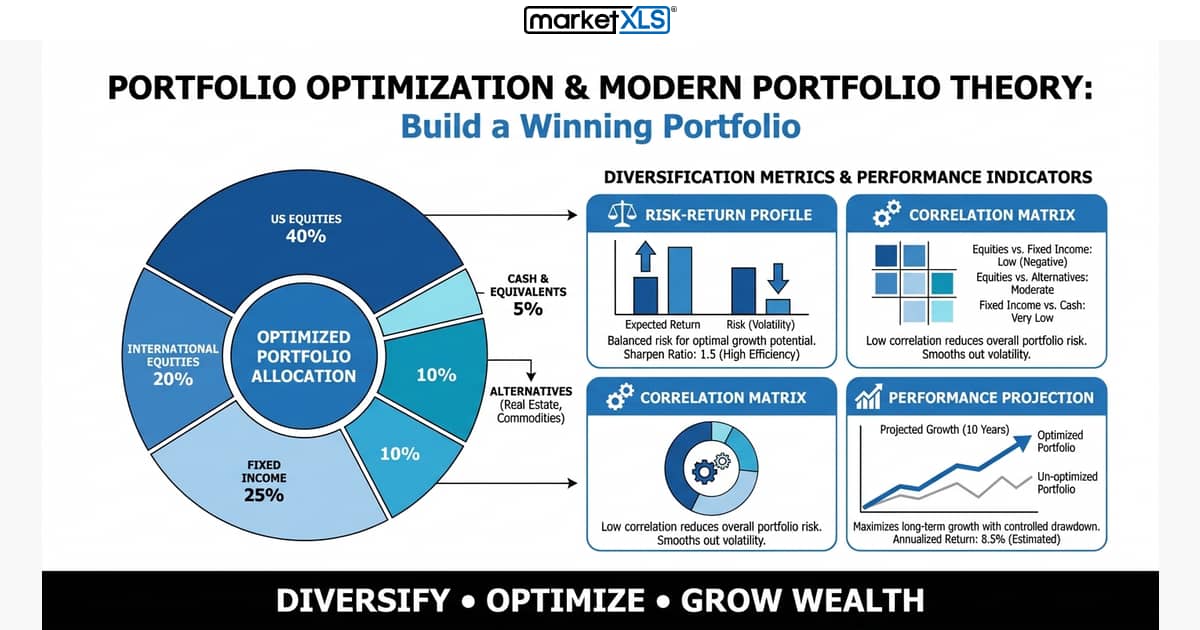
Portfolio optimization picks the asset mix with the highest expected return for a chosen level of risk. How Modern Portfolio Theory, the efficient frontier, and key risk metrics work.
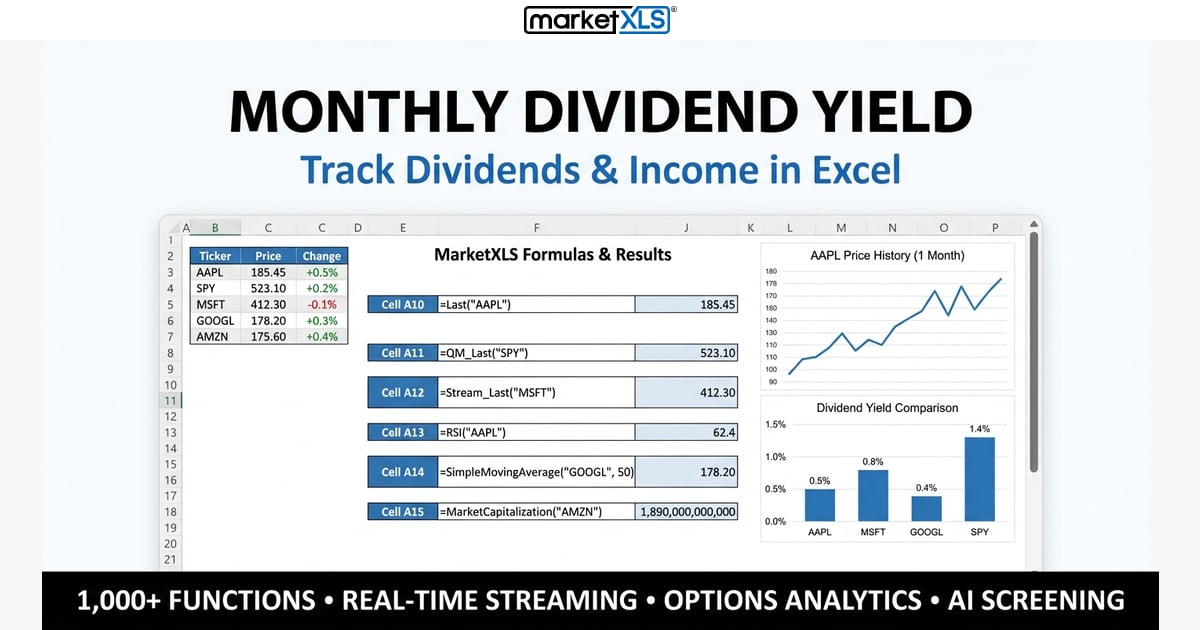
Monthly dividend yield is annual yield divided by 12. How to calculate it, and how to build a month-by-month dividend income tracker in Excel with MarketXLS.
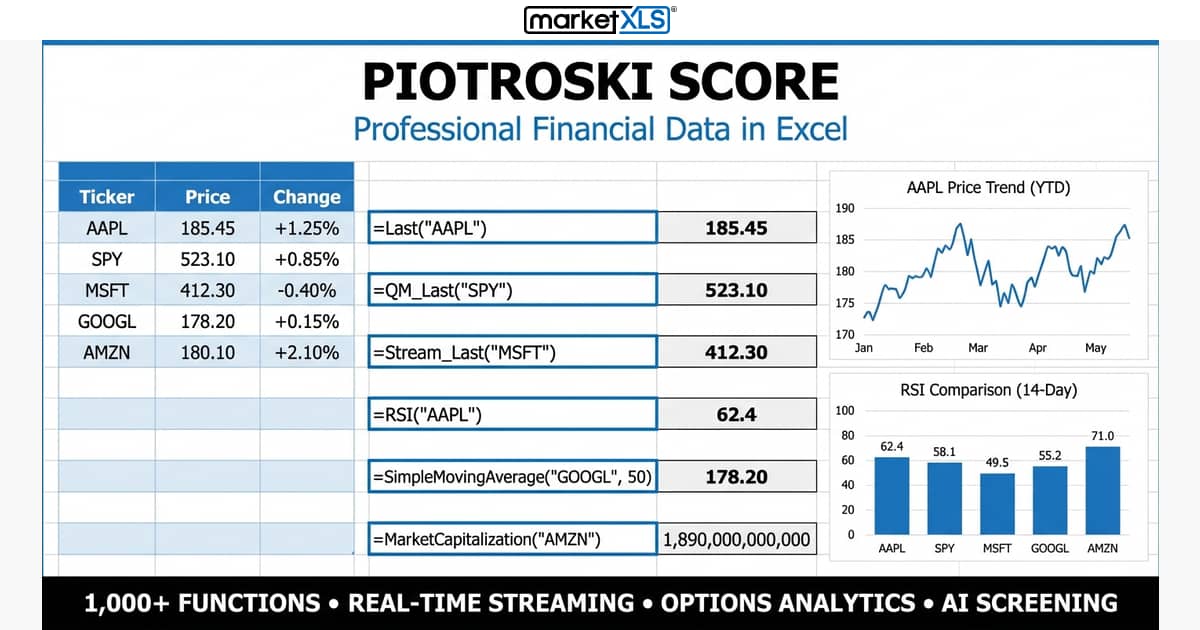
Piotroski Score guide covering all 9 F-Score criteria, calculation methods, value investing applications, and stock screening with MarketXLS.
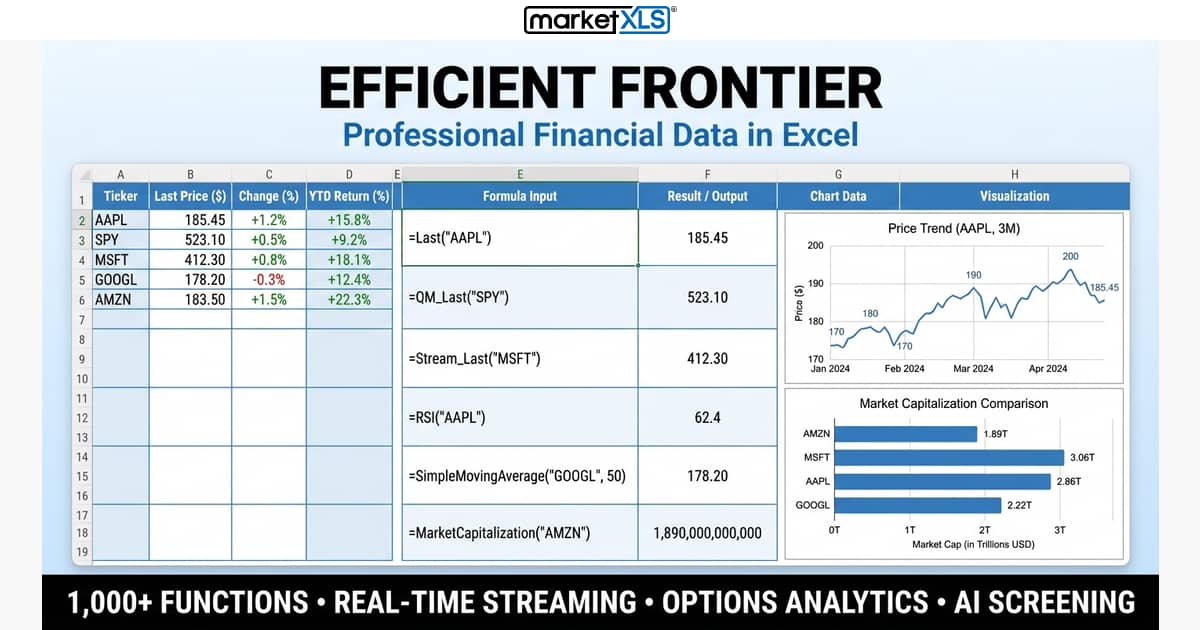
Efficient frontier analysis enables investors to find optimal portfolio allocations that maximize returns for any given level of risk using Modern Portfolio Theory and Excel-based tools.