
Real-Time RSI, VWAP and MACD Excel Watchlist Template
Description
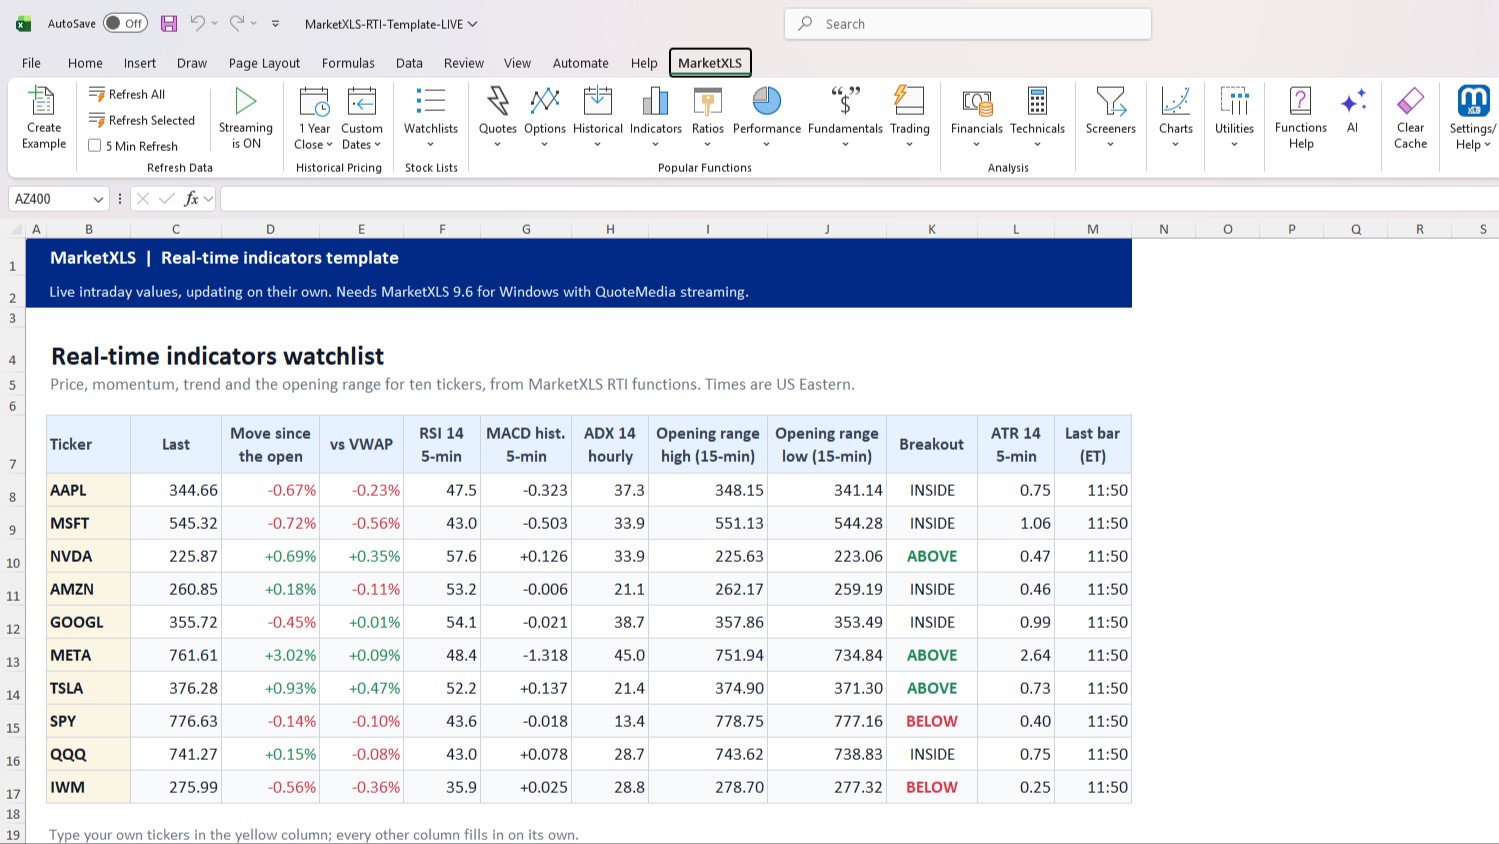
Live RSI, VWAP, MACD and Bollinger Bands for a stock watchlist in Excel, ready within seconds of opening the sheet, with the opening range and intraday signals.
What is in the template
- Watchlist: up to ten tickers with the last price, the move since the open, distance from the session VWAP, RSI 14 and MACD histogram on 5-minute bars, hourly ADX 14, the 15-minute opening range high and low, a breakout flag (above, inside or below the range) and ATR 14. RSI is shaded red above 70 and green below 30.
- Single stock: one ticker in depth: the opening range and its width, the price at 10:00, 11:00, 12:00, 13:00, 14:00 and 15:00 ET and the change since each, signals on completed 5-minute bars (RSI crossing up through 30, the MACD histogram turning positive, a close back above VWAP, a close above the upper Bollinger Band), current RSI, MACD, Bollinger Bands and VWAP, a stop level 2 ATRs below the price, and the 30-minute high and low.
- How it works: what each function does and what you need.
Type your own tickers in the yellow cells; every other column fills in on its own.
Why the indicators show a value straight away
A streaming RSI usually has to watch the market for its whole lookback period before it gives a number: a 14-bar RSI on 5-minute bars needs more than an hour. MarketXLS 9.6.6 loads the recent 1-minute history for each ticker, so every indicator in this sheet shows a real value within seconds of opening it, at any time of day. Any bar can be addressed by time: =RTI_High("AAPL",5,"09:30") is the high of the first 5-minute candle. Indicators are calculated with TA-Lib on regular-session bars (09:30 to 16:00 ET).
MarketXLS functions used
RTI_Last, RTI_VWAP, RTI_RSI, RTI_MACD, RTI_MACD_Signal, RTI_MACD_Histogram, RTI_BollingerBands, RTI_ATR, RTI_ADX, RTI_High, RTI_Low, RTI_Open, RTI_Close, RTI_Volume, RTI_Price_At_Min, RTI_Price_ChangePct_From_Min, RTI_HighestPrice_in_X_Mins, RTI_LowestPrice_in_X_Mins, RTI_Time and RTI_Status. Every RTI function, with examples, is in the RTI guide.
What you need
The MarketXLS add-in for Windows Excel, version 9.6.6 or later, with QuoteMedia real-time streaming set up (Settings > Data Subscriptions > QuoteMedia). RTI functions are not available in Excel Online, Excel for Mac or Google Sheets. The free preview file opens in any Excel: it holds values captured during a trading session and shows the formula behind each column.
Educational template, not investment advice.
Template Screenshots
Get Access to 1 Billion Usable Market data points IN YOUR EXCEL SHEETS WITH EASY TO USE EXCEL FUNCTIONS
Get started today
Similar Templates
No similar templates found