
Stock Charts in Excel




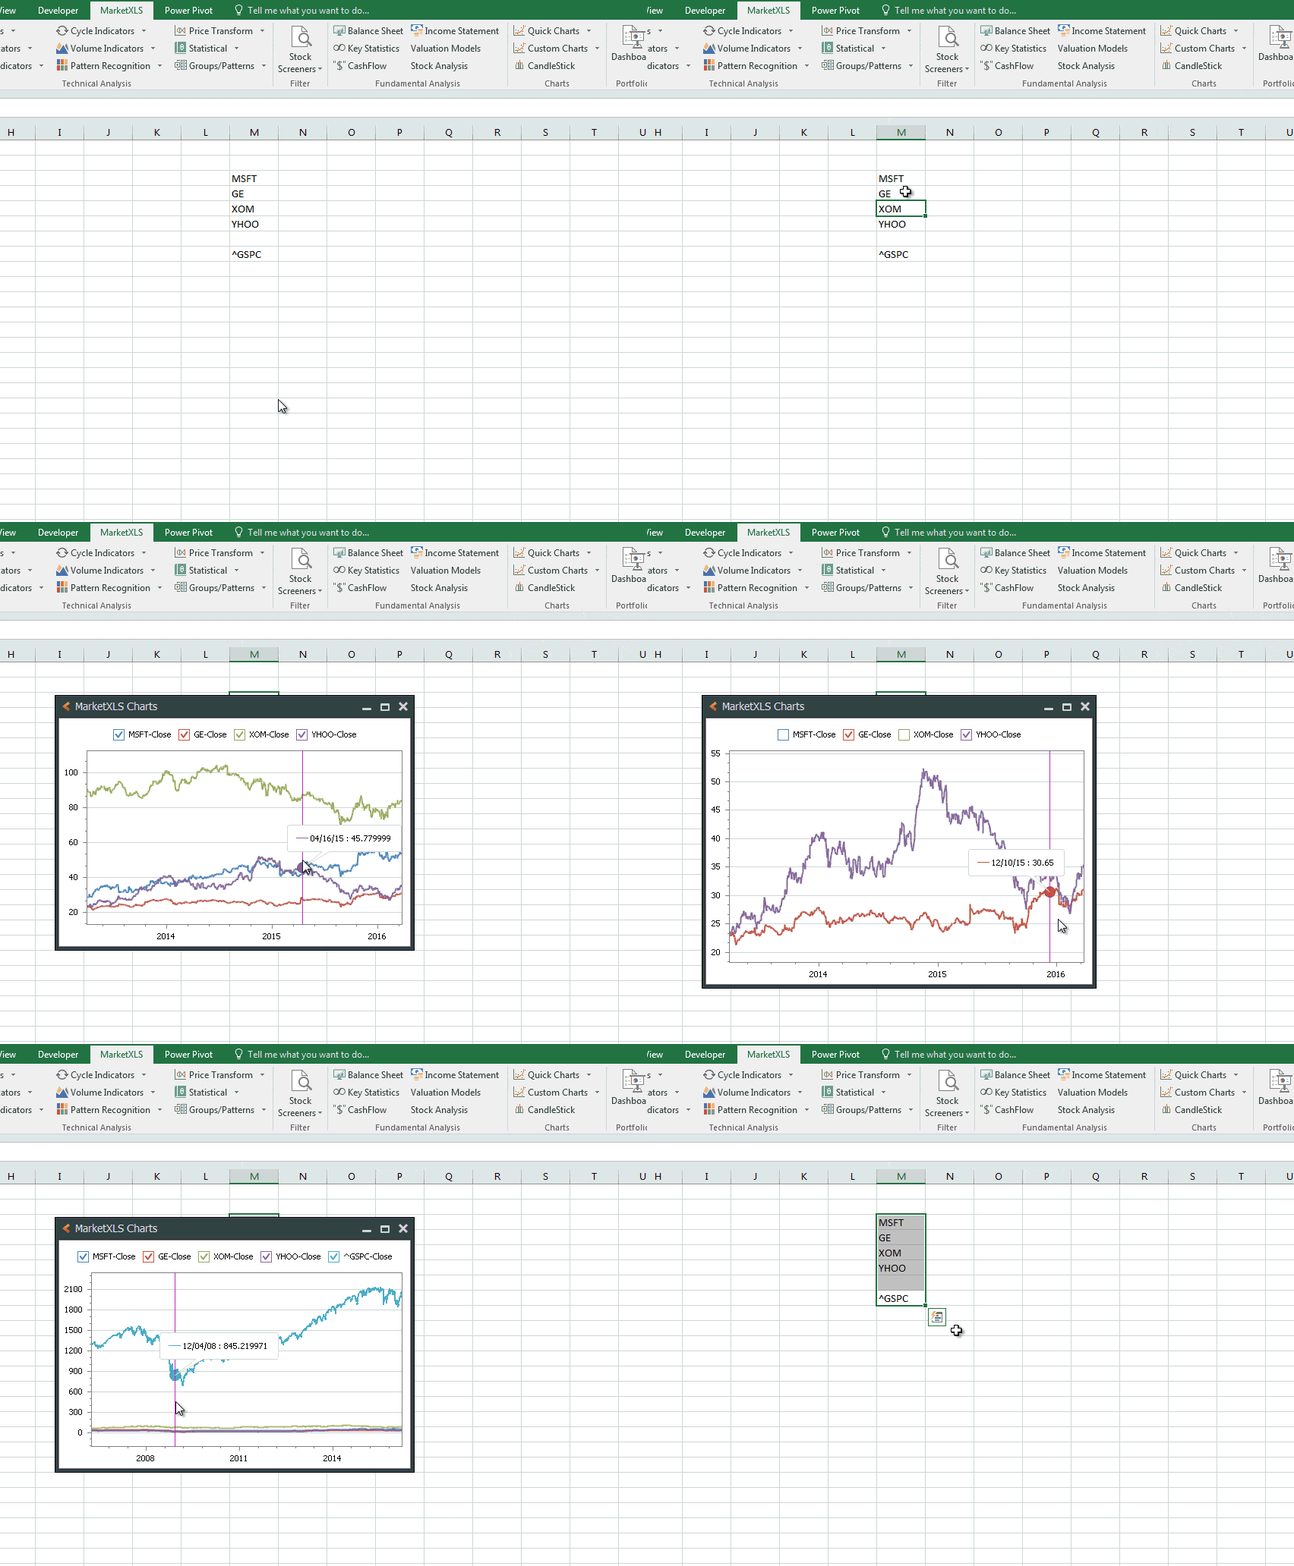
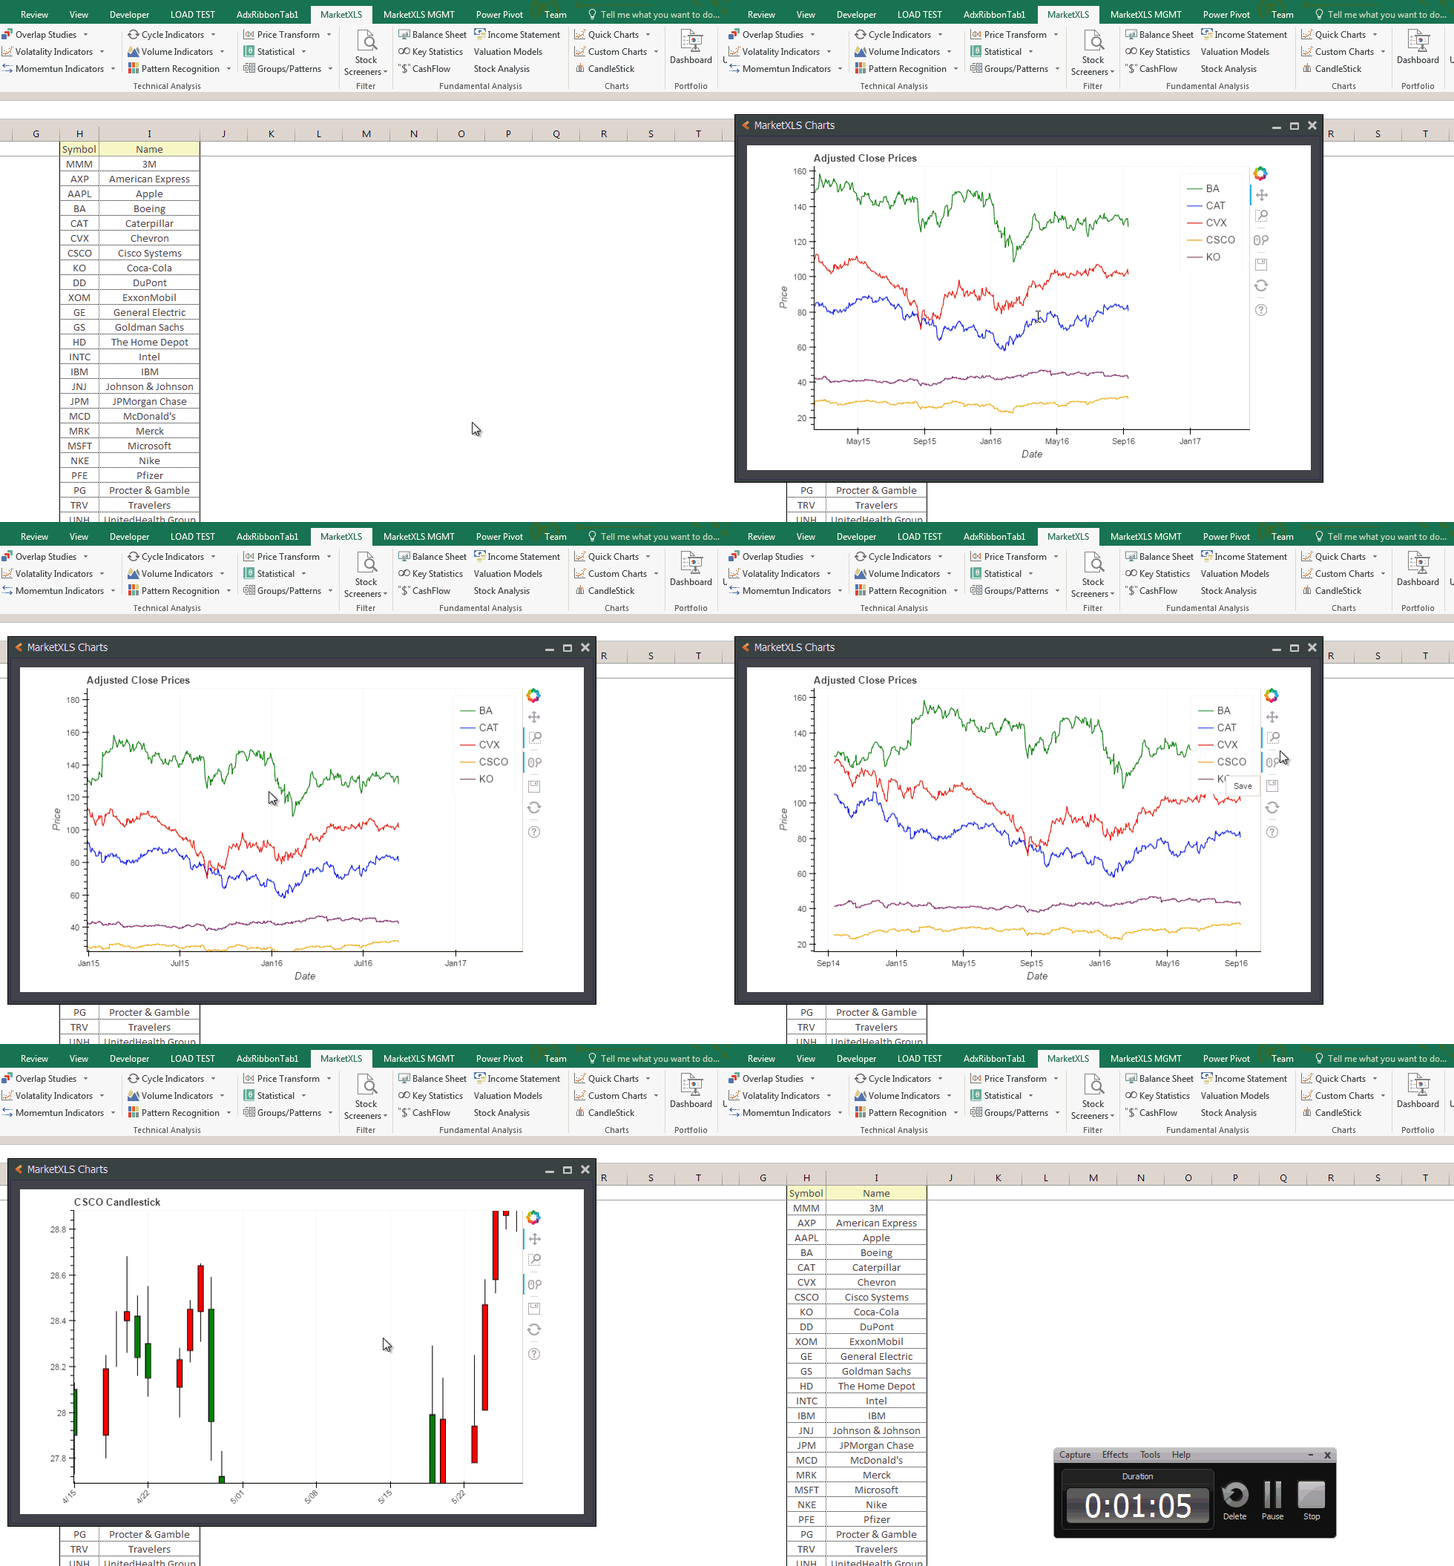
MarketXLS draws stock charts inside Excel. Select one or more tickers, or a range of your own data, and the MarketXLS charting tool reads the range and builds a price, candlestick, or multi-stock chart that you can zoom, add indicators to, and export as an image.
What you can do with MarketXLS charts
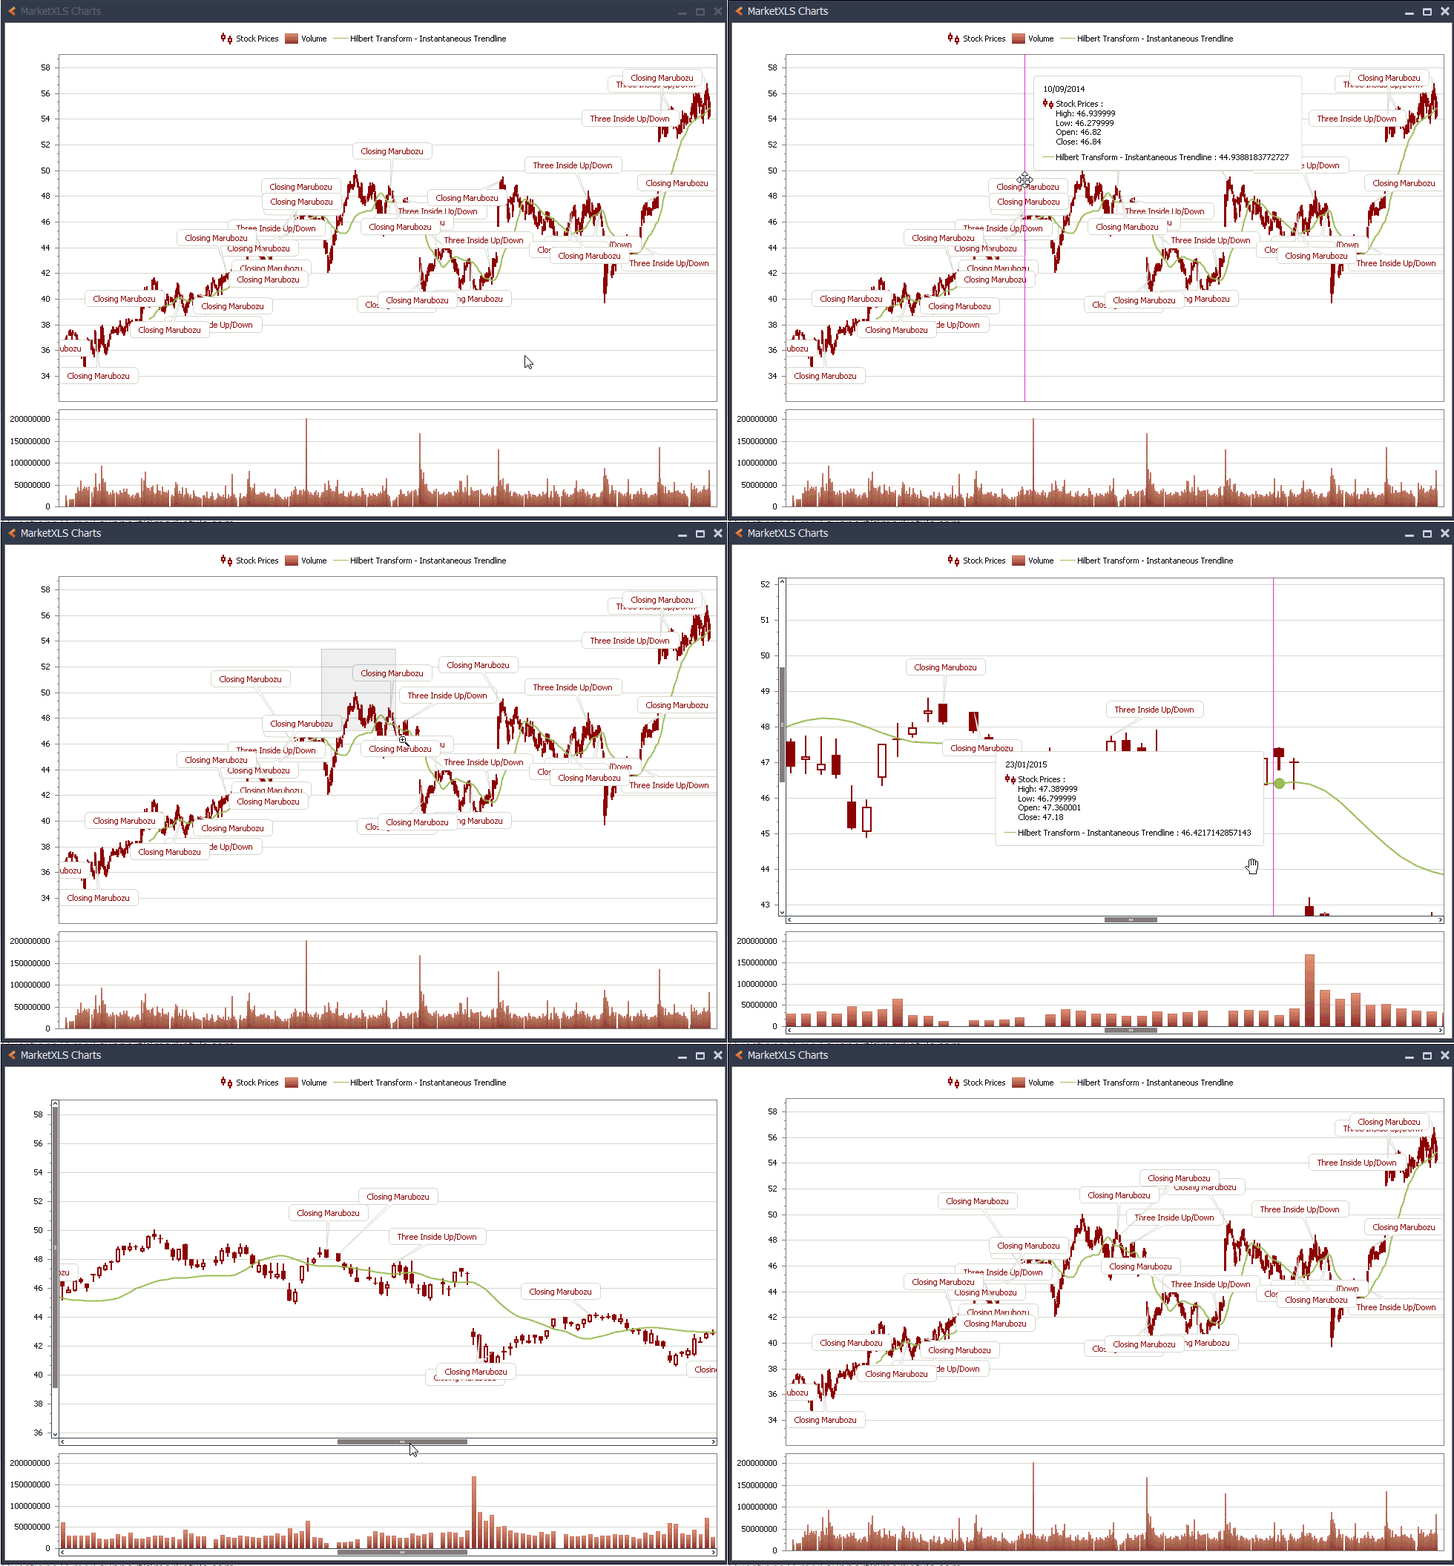
Create ready-made stock charts in Excel and make charts with your own dataset in Excel. Add panels, built-in indicators, and multiple axes. Zoom in and out, and the date format adjusts to the range. Export charts in several formats or copy them as PNG images. Annotate candlestick patterns on the chart.
The MarketXLS charting engine reads the selected Excel range and identifies the dates and values automatically, so you do not set up the chart series by hand. Charts can be maximized without losing quality, and several chart windows can be open at once. Unlike native Excel charts, MarketXLS charts support zooming and pattern annotation.
Chart Examples


Chart examples: select a group of stocks and click a chart type to get charts like these

Charts and data in one Excel add-in
The MarketXLS add-in that draws these charts also supplies the data behind them, so you can track a stock portfolio in the same workbook. Put MarketXLS formulas in your financial models or portfolio spreadsheets and the values refresh when the data updates.
MarketXLS charts cover a single stock or several stocks. Quick charts plot daily closing prices over one year, three years, or longer. You can also plot and annotate candlestick charts, or chart your own dataset instead of using native Excel charts.
Beyond charts, the MarketXLS add-in provides stock quotes (15-minute delayed on the Standard plan, real-time on Advanced and Business), options, ETF, and currency quotes, historical stock data in Excel, balance sheet, income statement, and cash flow metrics, and technical indicators.
See plans and prices on the MarketXLS pricing page.
Questions? Email support@marketxls.com
Call: 1-877-778-8358 
I'm Ankur, the founder and CEO of MarketXLS. Our team can demonstrate how MarketXLS brings market data and research tools into Excel.
Book a demo with our team to explore the features and workflows relevant to your research.
Book a demo with our team to explore the features and workflows relevant to your research.
Implement "your own" investment strategies in Excel with thousands of MarketXLS functions and templates.
I use MarketXLS to manage my personal portfolio. I can easily pull in stock quotes, betas, and dividends. I also like to access historical closing prices on a particular date. That makes tracking performance easy.
I have used lots of stock and option information services. This is the only one which gives me what I need inside Excel.
I can now concentrate on manipulating financial data, valuing stocks and making investment decisions, rather than hacking around with VBA or copying and pasting data from websites.
I have been using MarketXLS for the last 6+ years and they really enhanced the product every year.
I Love My MarketXLS. The market speaks to you when you know how to listen. With MarketXLS, the market truly does speak. Patterns emerge. Pricing behavior becomes clearer.