

Google Sheets' built-in GOOGLEFINANCE function returns ETF prices, volume, and price history, but not ETF-specific data such as net assets (AUM), expense ratio, top holdings, inception date, or option chains. To get those into Google Sheets, install the MarketXLS Google Sheets add-on and use its FundXLS fund functions, for example =FundExpenseRatio("SPY"), =FundNetAssets("SPY"), and =FundHoldings("SPY"). Google Sheets uses the same pricing as regular MarketXLS.
Try it in your own spreadsheet
Get the free MarketXLS sample workbook (.xlsx).
No account needed. MarketXLS live data requires a paid plan.
Explore more videos
MarketXLS access: Downloading a workbook does not include live data access. Refreshing MarketXLS formulas requires a paid MarketXLS subscription.
This guide lists which data GOOGLEFINANCE covers and which needs MarketXLS, shows the formulas for each column of an ETF watchlist, and builds a holdings overlap check, an allocation builder, and an asset class rollup. A sample workbook and a live-formula template are at the bottom.
ETF Data in Google Sheets: What GOOGLEFINANCE Covers vs What It Skips
GOOGLEFINANCE covers prices and price history; AUM, expense ratio, holdings, inception date, and option chains require MarketXLS or FundXLS functions. This table mirrors the "GOOGLEFINANCE vs MarketXLS" sheet in the downloadable workbook.
| Capability | GOOGLEFINANCE (Google Sheets) | MarketXLS / FundXLS |
|---|---|---|
| Live ETF last price | Yes (=GOOGLEFINANCE("SPY","price")) | Yes (=QM_Last("SPY")) |
| Open, high, low, close, volume | Yes | Yes (multiple QM_* functions) |
| Daily historical prices | Yes ("history" attribute) | Yes (=QM_GetHistory("SPY")) |
| Intraday 1-minute bars | Limited | Yes (=QM_GetMinuteData("SPY")) |
| 52-week high / low | Yes | Yes (=FiftyTwoWeekHigh, =FiftyTwoWeekLow) |
| ETF AUM / net assets | No | Yes (=FundNetAssets("SPY")) |
| ETF expense ratio | No | Yes (=FundExpenseRatio("SPY")) |
| ETF dividend yield (TTM + forward) | Limited | Yes (=DividendYield, =ForwardAnnualDividendYield) |
| ETF top holdings spill | No | Yes (=FundHoldings("SPY")) |
| Inception date and fund family | No | Yes (=FundInceptionDate, =FundFamily) |
| Overlap of two ETFs by holdings | No | Yes (using FundHoldings + sheet logic) |
| Beta vs market | No | Yes (=Beta("SPY")) |
| 30-day annualized volatility | No | Yes (=StockVolatilityThirtyDays) |
| Technical signals (SMA, RSI, MACD) | No | Yes (=SimpleMovingAverage, =RSI, =MACD) |
| Live option chain on the ETF | No | Yes (=QM_GetOptionChainActive("SPY")) |
| Number of functions | About a dozen attributes | 1,000+ functions |
| Native in Google Sheets | Yes | Yes via the MarketXLS Google Sheets add-on |
GOOGLEFINANCE handles prices and basic history. The ETF-specific data points that drive a fund comparison (cost, size, holdings) come from the FundXLS and MarketXLS functions.
ETF Data in Google Sheets: Why FundXLS Matters
FundXLS is the ETF and mutual fund data layer inside MarketXLS. It is the same data behind the FundXLS fund research pages and shows up in Excel and Google Sheets as a family of Fund* functions. The functions that matter for most ETF dashboards are short, predictable, and they accept a ticker string directly.
=FundNetAssets("SPY")          // ETF net assets in dollars (AUM)
=FundTotalAssets("SPY")        // ETF total assets
=FundExpenseRatio("SPY")       // Annual expense ratio %
=FundFamily("SPY")             // Issuer / fund family
=FundInceptionDate("SPY")      // Inception date
=FundHoldings("SPY")           // Top holdings as a spill array
=FundReportPeriodEndDate("SPY")// Reporting period end date
Formula documentation: FundNetAssets, FundTotalAssets, FundExpenseRatio, FundFamily, FundInceptionDate, FundHoldings, FundReportPeriodEndDate
In Google Sheets you call them exactly the same way once the MarketXLS add-on is installed and authenticated. The function returns the value into the cell, and spill functions like FundHoldings flow into the cells below and to the right just like a QUERY or IMPORTRANGE result would.
The rest of this guide assumes you have one ETF watchlist in a Google Sheets workbook, want to enrich it with FundXLS metrics, and would like the file to behave the same way it would in Excel.
ETF Data in Google Sheets: Build the Watchlist
Start with a tab called Main Dashboard and a 25-row watchlist of widely held funds. The columns mirror the downloadable workbook so you can swap between this guide and the file without losing your place.
| Column | Header | Formula (template version) |
|---|---|---|
| A | Ticker | SPY |
| B | Name | (typed in) |
| C | Asset Class | (typed in) |
| D | Last Price | =QM_Last(A2) |
| E | AUM ($B) | =FundNetAssets(A2)/1000000000 |
| F | Expense % | =FundExpenseRatio(A2) |
| G | Yield % | =DividendYield(A2) |
| H | YTD % | =ChangePercentYTD(A2) |
| I | 1-Yr % | =StockReturnYTD(A2) |
| J | 52W High | =FiftyTwoWeekHigh(A2) |
| K | 52W Low | =FiftyTwoWeekLow(A2) |
| L | Beta | =Beta(A2) |
| O | GOOGLEFINANCE Equivalent | =GOOGLEFINANCE(A2,"price") |
Column O is intentional. Keeping the GOOGLEFINANCE price next to the MarketXLS price makes it visually obvious which data points are duplicated across both engines and which ones only exist on the MarketXLS side. Once you scroll past the price column there is no GOOGLEFINANCE equivalent for AUM, expense ratio, or any of the FundXLS data points, and the empty cells make the case better than any marketing line could.
A starter universe to seed the dashboard with:
- US broad market: SPY, IVV, VOO, VTI, QQQ, DIA, IWM
- Factor tilts: VTV, VUG, SCHD
- Sectors: XLE, XLK, XLF, XLV, XLY, XLI, XLU, XLP
- International: VXUS, EFA, VWO
- Bonds: AGG, TLT, HYG
- Commodity: GLD
These 25 names cover most of the choices a financial advisor or self-directed investor will compare in a routine planning session, and the asset class column at the front feeds the rollup tab later in the workbook.
ETF Data in Google Sheets: Cost-Quality Score in a Single Formula
A useful side effect of having every metric live in the same row is that you can score ETFs on multiple axes in one formula. The downloadable workbook ships with a Cost-Quality Score that blends four buckets, each worth 25 points:
- Expense ratio (lower is better; below 0.05% scores 25, 0.5% or above scores 0)
- 1-year return (capped at 20% upside, floored at -10%)
- AUM (above 50 billion scores 25, below 1 billion scores 0)
- Dividend yield (each percentage point worth 12.5 points up to the cap)
The formula sitting in column M of the dashboard reads:
=ROUND(
  MAX(0, MIN(25, 25 * (1 - F2/0.5)))
  + MAX(0, MIN(25, 25 * ((I2 + 10)/30)))
  + MAX(0, MIN(25, 25 * (E2/50)))
  + MAX(0, MIN(25, 12.5 * G2))
, 0)
Reading the score is intuitive. A composite of 70 or higher means the fund is large, inexpensive, has delivered, and pays something. A score below 30 means at least two of those four legs are missing. The verdict column wraps the score in an IF ladder that prints "Strong", "Solid", "Watch", or "Weak", which is the kind of label that survives a quick share to a colleague.
This is one of those analyses that is technically possible in Google Sheets alone, except that without FundXLS you have to type the expense ratio, AUM, and yield by hand from the ETF sponsor's web page. With the add-on installed those four numbers are formulas, so the score updates when the underlying data updates.
ETF Data in Google Sheets: The MarketXLS Google Sheets Add-On
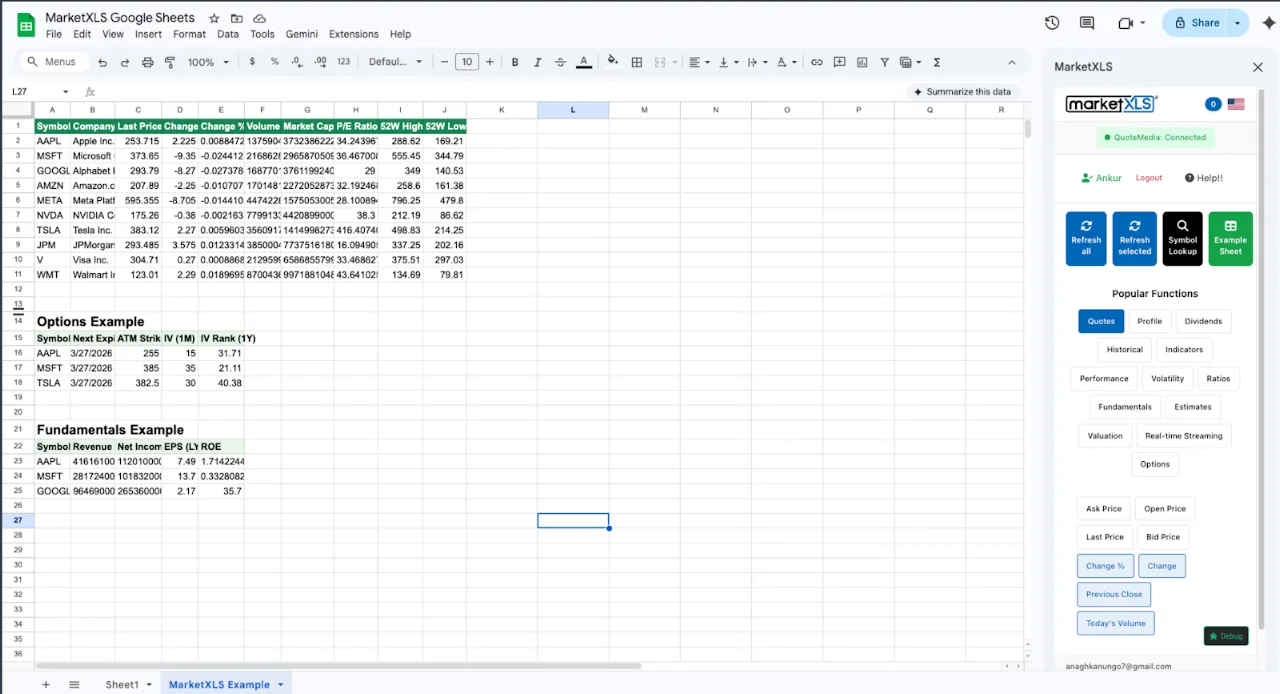
The bridge that makes all of this work inside Google Sheets is the MarketXLS Google Sheets add-on. Once installed and authenticated against your MarketXLS account, the same family of functions you would type into Excel desktop becomes available in any Google Sheets workbook you own. That includes QM_Last, FundExpenseRatio, FundNetAssets, FundHoldings, Beta, DividendYield, and the rest of the 1,000+ function library that you can browse in the MarketXLS formula reference. Function availability differs by platform, so check the reference for any function you plan to rely on.
A few behaviors are worth knowing before you build a heavy dashboard:
- Google Sheets caches results aggressively. If a function returns a stale value, force a recalculation by editing and re-entering the cell, or by toggling a refresh helper cell that every formula references.
- Spill functions like
FundHoldings(A2)andQM_GetHistory(A2)flow downward and to the right. Reserve clear space below them so the spill is not blocked. - In Excel, streaming functions such as
=QM_Stream_Last("SPY")update automatically while streaming is on (real-time streaming requires the Advanced or Business plan). Google Sheets does not stream ticks; the recalculation cadence is set by Sheets itself. - Sheet-to-sheet references (
='Main Dashboard'!G13) behave the same way they do in Excel, which keeps the allocation builder and the asset class rollup portable across the two platforms.
If your workflow is entirely in Google Sheets, the Google Sheets add-on covers it. If you mix Excel and Sheets, the same MarketXLS account works in both; formula syntax can differ by platform (for example, the Microsoft 365 Excel add-in uses the mxls. prefix), so check /formulas when moving a workbook.
ETF Data in Google Sheets: Holdings, Overlap, and the Drilldown Sheet
For ETF data the single most valuable thing you can pull, beyond AUM and expense ratio, is the live top holdings spill. The reason is that the moment you start combining two or three funds in a portfolio, you start double-counting names. SPY and QQQ share Apple, Microsoft, NVIDIA, Amazon, Meta, and Alphabet at non-trivial weights. Adding both funds to an account is not as diversifying as the ticker list suggests, and a top-of-portfolio holdings overlap check is the fastest sanity check you can run.
In the workbook the Holdings Drilldown sheet works like this:
B4 = SPY              (input cell, yellow)
B5 = QQQ              (input cell, yellow)
B6 = =FundFamily(B4)
B7 = =FundInceptionDate(B4)
B8 = =FundNetAssets(B4)
B9 = =FundExpenseRatio(B4)

A12 = =FundHoldings(B4)   // spills the SPY top holdings
A25 = =FundHoldings(B5)   // spills the QQQ top holdings
Formula documentation: FundFamily, FundInceptionDate, FundNetAssets, FundExpenseRatio, FundHoldings
Once both spills are in place, you can compare them. Inside Google Sheets the cleanest way is an XLOOKUP from the ticker column of one spill against the other, returning the weight if matched and 0 if not, then summing the lower of the two weights row by row to produce an overlap score in percent. The sample version of the workbook ships with the overlap pre-built using static snapshots of SPY and QQQ holdings so you can see the structure before you type a single formula yourself.
Used this way, the Holdings Drilldown becomes the answer to the question "do these two funds give me real diversification or am I just paying two expense ratios for the same megacap basket?" You can also run the same check without a spreadsheet using the free ETF overlap calculator.
ETF Data in Google Sheets: Allocation Builder With Live Yield and Fees
The Allocation Builder sheet turns the watchlist into three sized portfolios. The portfolio size is a single input cell that the user changes, and the rest of the sheet references it. Three models ship in the workbook:
- Conservative: 45% bonds and gold, around 30% defensive equity, around 25% growth and international. Built for capital preservation.
- Balanced: 60/30/10 equity, bond, alternative. Diversified across factors and regions.
- Aggressive: roughly 95% equity tilt with growth, small caps, and emerging markets. Highest expected volatility.
Each row in a model uses the same pattern:
A: Model name
B: Ticker
C: Name (looked up)
D: Weight % (typed; sums to the model's stated weight)
E: =$B$4*D7/100             // dollar allocation
F: ='Main Dashboard'!G13    // live yield from the dashboard row
G: =E7*F7/100               // projected annual income
H: ='Main Dashboard'!F13    // live expense ratio from the dashboard
I: =E7*H7/100               // annual fund fee in dollars
Formula documentation: Name
The model totals row at the bottom uses SUM on the dollar columns and a weighted average on the yield and expense columns. With live formulas in place, you change a single dashboard input ("portfolio size") and every model's projected annual income, total fund fees, and dollar allocation update on recalculation. The same workbook in a static Google Sheets file would require manual entry on three to four columns per model and would silently go stale.
ETF Data in Google Sheets: Asset Class Rollup
The final analytical sheet is an asset class rollup using AVERAGEIFS against the asset class column on the dashboard. The buckets are Equity, Sector, International, Bond, and Commodity, and the table averages expense ratio, yield, YTD return, 1-year return, beta, and the Cost-Quality Score within each bucket.
=COUNTIF('Main Dashboard'!$C$13:$C$37, A5)
=IFERROR(AVERAGEIFS('Main Dashboard'!$F$13:$F$37, 'Main Dashboard'!$C$13:$C$37, A5), 0)
=IFERROR(AVERAGEIFS('Main Dashboard'!$G$13:$G$37, 'Main Dashboard'!$C$13:$C$37, A5), 0)
Reading the asset class rollup is a top-down exercise. Broad equity funds usually have the lowest expense ratios in the table. Sector ETFs cluster in the 0.10 to 0.40% expense band and can carry higher single-bucket volatility. International ETFs trade off geographic diversification for currency volatility. Bond ETFs anchor yield but long-duration ones swing with rate expectations. Commodity ETFs like GLD often act as a portfolio diversifier when stocks and bonds correlate.
None of this analysis is possible inside a GOOGLEFINANCE-only sheet. Every aggregation depends on the expense ratio and yield columns being live numbers, and those columns are MarketXLS / FundXLS only.
ETF Data in Google Sheets: Verified Formula Reference
These are the MarketXLS formulas used in the workbook.
| Use case | Formula | Notes |
|---|---|---|
| Live last price | =QM_Last("SPY") | Equivalent of =GOOGLEFINANCE("SPY","price") |
| AUM | =FundNetAssets("SPY") | Net assets in dollars |
| Total assets | =FundTotalAssets("SPY") | Total assets in dollars |
| Expense ratio | =FundExpenseRatio("SPY") | Annual expense ratio % |
| TTM dividend yield | =DividendYield("SPY") | Trailing 12-month yield |
| Forward yield | =ForwardAnnualDividendYield("SPY") | Forward annual yield estimate |
| Fund family | =FundFamily("SPY") | Issuer name |
| Inception date | =FundInceptionDate("SPY") | Date string |
| Top holdings spill | =FundHoldings("SPY") | Returns top constituents |
| Reporting period end | =FundReportPeriodEndDate("SPY") | Reporting period end date |
| 52-week high | =FiftyTwoWeekHigh("SPY") | Currency-formatted |
| 52-week low | =FiftyTwoWeekLow("SPY") | Currency-formatted |
| Daily history spill | =QM_GetHistory("SPY") | OHLCV table |
| 1-minute bars spill | =QM_GetMinuteData("SPY") | Intraday bars |
| Beta vs market | =Beta("SPY") | Single number |
| 30-day annualized vol | =StockVolatilityThirtyDays("SPY") | Percent |
| 50-day SMA | =SimpleMovingAverage("SPY", 50) | Period as second arg |
| RSI 14 | =RSI("SPY") | 14-period default |
| MACD | =MACD("SPY") | Default 12/26/9 |
| Year-to-date price change | =ChangePercentYTD("SPY") | Percent |
| Year-to-date total return | =StockReturnYTD("SPY") | Percent |
| Average daily volume | =AverageDailyVolume("SPY") | Shares |
| Live option chain spill | =QM_GetOptionChainActive("SPY") | Full chain |
Reading list: if you are coming from Excel and want a refresher on which Google Sheets behaviors differ, the MarketXLS formula reference is the catalog the FundXLS family lives inside, and FundXLS covers the fund research pages built on the same data.
Download the Templates
Download the templates:
- - Pre-filled with snapshot data so you can see what the dashboard looks like before you connect MarketXLS or the Google Sheets add-on.
- - Live formulas in every data cell, ready to refresh once the MarketXLS Google Sheets add-on or Excel desktop is connected.
Both files are built in Excel. To use the formula version in Google Sheets, open it in Sheets with the MarketXLS Google Sheets add-on installed and let the formulas recalculate; check /formulas for any function that is not available on your platform.
FAQ: ETF Data in Google Sheets
Can GOOGLEFINANCE return ETF expense ratios or AUM?
No. GOOGLEFINANCE exposes about a dozen attributes for stocks and ETFs, all centered on price, volume, and a handful of basic fundamentals. ETF AUM (net assets) and expense ratios are not in the list. For those you need FundXLS / MarketXLS formulas like =FundNetAssets("SPY") and =FundExpenseRatio("SPY").
How do I pull the top holdings of an ETF into Google Sheets?
Use the MarketXLS Google Sheets add-on and call =FundHoldings("SPY"). The function returns the top holdings as a spill array, with ticker, name, and weight columns. Make sure the cells below the formula are empty so the spill has room.
Does the MarketXLS Google Sheets add-on require Excel?
No. The Google Sheets add-on connects directly to your MarketXLS account and runs inside Sheets. If you also use Excel, the same MarketXLS account works there. Google Sheets uses the same pricing as regular MarketXLS; see /pricing.
Will the formulas refresh automatically in Google Sheets?
Google Sheets recalculates spreadsheet formulas when inputs change and on a polling cadence that Sheets itself controls. For ETF data that does not move tick by tick (expense ratio, AUM, inception date, fund family) the cadence is plenty. For prices the values update on the standard Sheets refresh; for live tick streaming you would use MarketXLS in Excel with QM_Stream_* functions on the Advanced or Business plan.
How do I check if two ETFs overlap in their holdings?
Pull =FundHoldings(ETF1) and =FundHoldings(ETF2) into two spill ranges. Join them on ticker using XLOOKUP or FILTER, take the minimum weight of each shared ticker, and sum those minimums. The result is the percentage of each portfolio that is duplicated across the two funds. The downloadable workbook ships with this overlap pre-built for SPY and QQQ so you can study the structure.
Is this enough data to do real ETF research in Google Sheets?
The 1,000+ MarketXLS functions, including the FundXLS family, cover the data points most advisors and self-directed investors reach for: price, AUM, expense ratio, holdings, yield, return, beta, volatility, sector, inception date, fund family, option chains, and historical pricing. For most ETF research workflows that is sufficient inside Google Sheets. Areas where you might still want Excel are streaming prices and very large historical data pulls.
The Bottom Line
GOOGLEFINANCE covers ETF prices and history in Google Sheets. For AUM, expense ratio, top holdings, inception date, and option chains, use the FundXLS functions in the MarketXLS Google Sheets add-on, which return those values into cells instead of requiring copy-paste from fund sponsor sites.
The pattern that produces a working dashboard is simple. Keep one row per ticker, use QM_Last and the Fund* family for the ETF-specific columns, layer GOOGLEFINANCE alongside as a visible reminder of where the native ceiling is, and build the secondary sheets (holdings, allocation, rollup) on references back to the dashboard so a single input change cascades through the file. The downloadable workbook is the starting point. Pricing and account options live on the MarketXLS pricing page. To see the Google Sheets add-on and the FundXLS function family in action against your own watchlist, book a demo and we will walk through the workbook live.
This template is educational only and not a recommendation to buy or sell any security. Past performance does not guarantee future results.
