

The simplest way to get stock data in Google Sheets is the free built-in GOOGLEFINANCE function: =GOOGLEFINANCE("AAPL","price") returns Apple's last price, and other attributes return P/E, EPS, market cap, beta, 52-week range, and daily price history. Google says its quotes may be delayed up to 20 minutes, and it does not provide dividend yield, adjusted closes, options, or multi-year financial statements. For those, the MarketXLS Google Sheets add-on (installed from the Google Workspace Marketplace) adds 1,000+ functions such as =DividendYield("AAPL") and =QM_GetOptionChain("AAPL"), with plans from $70/month billed annually.
Try it in your own spreadsheet
Get the free MarketXLS sample workbook (.xlsx).
No account needed. MarketXLS live data requires a paid plan.
Explore more videos
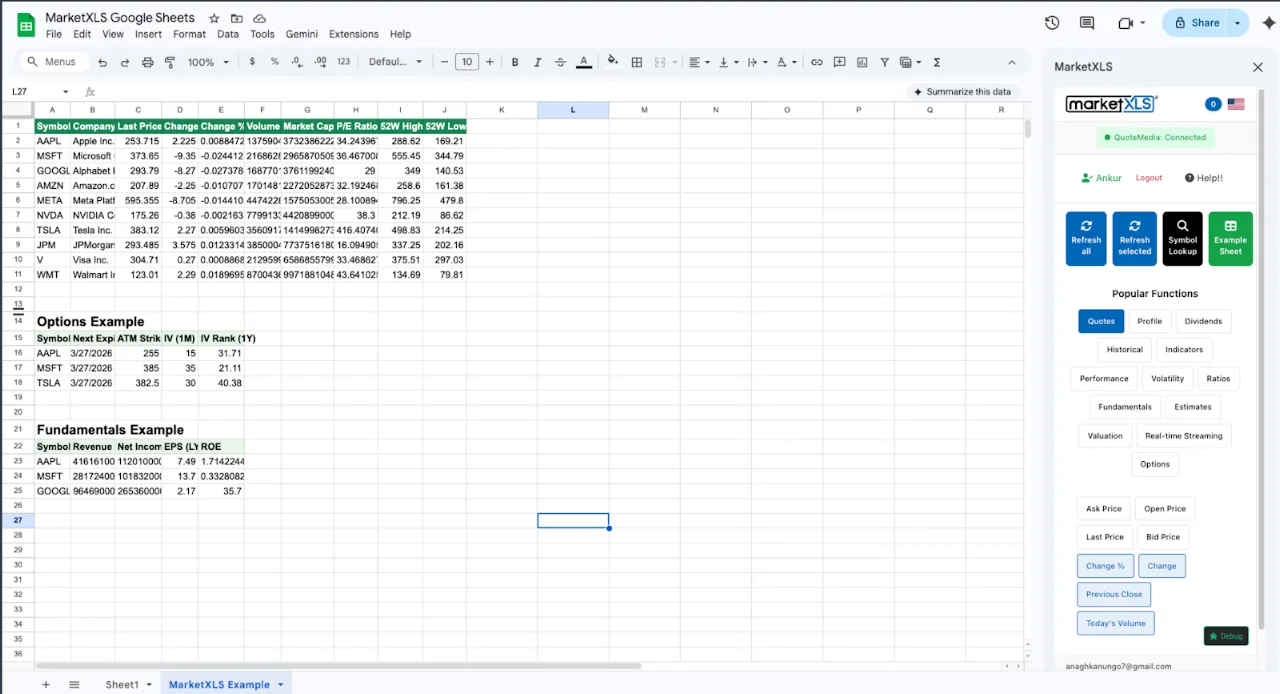
This guide walks through every GOOGLEFINANCE attribute, a 10-name watchlist, history pulls, and the portfolio formulas you can build on top. It then shows where GOOGLEFINANCE stops and which MarketXLS formula fills each gap. Two free templates are at the bottom of the post.
MarketXLS access: Downloading a workbook does not include live data access. Refreshing MarketXLS formulas requires a paid MarketXLS subscription.
Why Google Sheets works well for stock data
Before we get into the formulas, it is worth saying why Google Sheets has become the default for retail investors, finance students, and a lot of advisors building light dashboards.
| What you get for free in Google Sheets | Why it matters |
|---|---|
GOOGLEFINANCE formula for live prices | Single function, no setup, works everywhere |
| Cloud-native, multi-device | Same workbook on your phone, laptop, and tablet |
| Shareable with one link | Send a watchlist to a friend or advisor in seconds |
| Built-in charts and pivots | No extra plugin needed |
| Apps Script for custom logic | Free JavaScript-based scripting layer |
| Tied to Google's market data feed | Decent coverage on US listings, ETFs, indices, crypto |
| Auto-saved, version history | Never lose your work |
For a "build a watchlist, track a few positions, calculate weighted returns" use case, this is more than enough. It is also remarkable that you can go from "I want to track stocks in a spreadsheet" to a working tracker in under five minutes. That low friction is the whole point.
There is no real reason to migrate off Sheets if Sheets is doing the job. Most of the time, Sheets is doing the job.
The GOOGLEFINANCE function in one screen
Here is the entire attribute surface of GOOGLEFINANCE in one table. If you bookmark only one thing from this post, bookmark this.
| Attribute | What it returns | Example |
|---|---|---|
price | Last traded price | =GOOGLEFINANCE("AAPL","price") |
priceopen | Today's opening price | =GOOGLEFINANCE("AAPL","priceopen") |
high | Day high so far | =GOOGLEFINANCE("AAPL","high") |
low | Day low so far | =GOOGLEFINANCE("AAPL","low") |
volume | Day volume | =GOOGLEFINANCE("AAPL","volume") |
marketcap | Market capitalization | =GOOGLEFINANCE("AAPL","marketcap") |
pe | Trailing P/E ratio | =GOOGLEFINANCE("AAPL","pe") |
eps | Earnings per share (TTM) | =GOOGLEFINANCE("AAPL","eps") |
beta | Beta vs the market | =GOOGLEFINANCE("AAPL","beta") |
high52 | 52-week high | =GOOGLEFINANCE("AAPL","high52") |
low52 | 52-week low | =GOOGLEFINANCE("AAPL","low52") |
change | Change since previous close | =GOOGLEFINANCE("AAPL","change") |
changepct | Percent change today | =GOOGLEFINANCE("AAPL","changepct") |
closeyest | Previous close | =GOOGLEFINANCE("AAPL","closeyest") |
shares | Shares outstanding | =GOOGLEFINANCE("AAPL","shares") |
currency | Quote currency | =GOOGLEFINANCE("AAPL","currency") |
tradetime | Time of last trade | =GOOGLEFINANCE("AAPL","tradetime") |
datadelay | Quote delay in minutes | =GOOGLEFINANCE("AAPL","datadelay") |
close | Daily close on a date or series | =GOOGLEFINANCE("AAPL","close",DATE(2026,5,1)) |
all | Historical OHLCV table | =GOOGLEFINANCE("AAPL","all",DATE(2024,1,1),DATE(2026,1,1)) |
That is the whole API surface of stock data in Google Sheets. It is small, but it covers most of the questions a self-directed investor actually asks day to day.
A few practical notes that save people hours.
First, the second argument is case-insensitive but the attribute string must be in quotes. =GOOGLEFINANCE("AAPL", price) will not work. =GOOGLEFINANCE("AAPL","price") will.
Second, Google documents GOOGLEFINANCE quotes as delayed by up to 20 minutes, so do not treat them as tick-by-tick. They suit portfolio dashboards, not active trading.
Third, the historical functions spill into adjacent cells. If =GOOGLEFINANCE("AAPL","all",DATE(2024,1,1),DATE(2026,1,1)) is in cell A1, the date column lands in A, open in B, high in C, low in D, close in E, volume in F. Plan your sheet layout around that.
Building a real watchlist - 10 lines of formulas
Here is the exact recipe for a working 10-name watchlist in Google Sheets. Open a new sheet and paste tickers in column A starting at A2.
A2: AAPL
A3: MSFT
A4: GOOGL
A5: AMZN
A6: NVDA
A7: JPM
A8: KO
A9: JNJ
A10: SPY
A11: VOO
Then in row 2 (drag down to row 11 for each):
| Cell | Formula |
|---|---|
| B2 | =GOOGLEFINANCE(A2,"price") |
| C2 | =GOOGLEFINANCE(A2,"changepct") |
| D2 | =GOOGLEFINANCE(A2,"high52") |
| E2 | =GOOGLEFINANCE(A2,"low52") |
| F2 | =GOOGLEFINANCE(A2,"pe") |
| G2 | =GOOGLEFINANCE(A2,"eps") |
| H2 | =GOOGLEFINANCE(A2,"beta") |
| I2 | =GOOGLEFINANCE(A2,"marketcap") |
| J2 | =GOOGLEFINANCE(A2,"volume") |
You now have a live watchlist with last price, percent change today, 52-week range, valuation, EPS, beta, market cap, and volume. Format column I as [$0,, "M"] to display market cap in millions, or [$0,,,"B"] for billions.
For the static sample workbook included with this post, here is what those values looked like at the close on 2026-05-13:
| Ticker | Last | Day % | 52W High | 52W Low | P/E | Beta | Sector |
|---|---|---|---|---|---|---|---|
| AAPL | $232.18 | +0.72% | $245.10 | $198.65 | 28.4 | 1.18 | Technology |
| MSFT | $461.20 | +0.41% | $478.55 | $388.20 | 35.1 | 0.96 | Technology |
| GOOGL | $184.50 | +0.89% | $195.60 | $145.30 | 24.9 | 1.05 | Communication Services |
| AMZN | $218.30 | +1.14% | $231.40 | $165.20 | 41.8 | 1.14 | Consumer Discretionary |
| NVDA | $145.10 | +1.88% | $159.80 | $95.40 | 52.0 | 1.55 | Information Technology |
| JPM | $222.40 | +0.35% | $235.20 | $180.15 | 12.6 | 1.06 | Financials |
| KO | $71.80 | +0.14% | $75.20 | $62.10 | 26.3 | 0.62 | Consumer Staples |
| JNJ | $158.40 | +0.19% | $168.80 | $145.30 | 23.8 | 0.55 | Health Care |
| SPY | $545.10 | +0.46% | $562.45 | $489.15 | 22.1 | 1.00 | Index ETF |
| VOO | $501.20 | +0.46% | $517.60 | $449.40 | 22.1 | 1.00 | Index ETF |
Illustrative snapshot for the workbook. Not a recommendation.
Pulling history with =GOOGLEFINANCE("ticker","all",...)
The most underrated GOOGLEFINANCE capability is historical OHLCV. One formula gives you years of clean daily data with no API calls, no rate limits, no developer setup.
=GOOGLEFINANCE("AAPL","all",DATE(2024,1,1),DATE(2026,1,1),"DAILY")
Place that in A1 on a fresh sheet and you will see a header row plus daily rows: Date, Open, High, Low, Close, Volume. Replace "DAILY" with "WEEKLY" for weekly bars.
A few things to know.
The third argument can be a single date if you only want one specific close. The fourth is the end date. The fifth is the interval.
The series is unadjusted. Splits and dividends are not back-applied to the price column. If you need adjusted close for total return work, you have to either compute it yourself (multiply by split ratios, add back dividends) or step to a tool that returns an adjusted series directly.
There is no built-in volume-weighted average price, no rolling indicator, no RSI. If you want those, you build them with AVERAGE, STDEV, helper columns, and ARRAYFORMULA. That is fine for a few hundred bars. It gets fiddly past that.
Currency, crypto, and international tickers
Google Sheets understands a wider universe than most people realize.
=GOOGLEFINANCE("BTCUSD","price")           // Bitcoin in USD
=GOOGLEFINANCE("EURUSD","price")           // EUR/USD spot
=GOOGLEFINANCE("CURRENCY:USDJPY")          // USD/JPY long form
=GOOGLEFINANCE("LON:VOD","price")          // Vodafone on London Stock Exchange
=GOOGLEFINANCE("TYO:7203","price")         // Toyota on Tokyo Stock Exchange
=GOOGLEFINANCE("EPA:AIR","price")          // Airbus on Euronext Paris
=GOOGLEFINANCE("ETR:SAP","price")          // SAP on Xetra
=GOOGLEFINANCE(".DJI","price")             // Dow Jones index
=GOOGLEFINANCE("INDEXSP:.INX","price")     // S&P 500 long form
International coverage is good for prices but thinner for fundamentals. pe and eps may come back as #N/A on some non-US listings. That is a normal limitation, not a bug in your sheet.
Light formulas that turn a watchlist into a portfolio
You can go a long way without leaving Sheets.
Portfolio value:
=SUMPRODUCT(shares_range, GOOGLEFINANCE_price_range)
Daily P&L:
=SUMPRODUCT(shares_range, change_range)
Weighted P/E:
=SUMPRODUCT(weight_range, pe_range)
Cost basis vs current value per row:
=B2*A2 - cost_basis
Sharpe-style score using STDEV of weekly returns:
=AVERAGE(weekly_return_range)/STDEV(weekly_return_range)*SQRT(52)
For most investors building a personal dashboard, this set of patterns plus the GOOGLEFINANCE attributes covers every metric they actually use. There is no need to step outside Sheets.
Auto-refresh, conditional formatting, and the polish layer
A workbook is only as useful as it is glanceable. Some quick polish that makes a Sheets workbook feel like a real dashboard.
Set the recalculation cadence under File then Settings then Calculation. The choices are "On change", "On change and every minute", and "On change and every hour". Pick the one that matches how often you actually look at the sheet.
Add conditional formatting on the day-percent column. Negative values get a red background, positive get green. That single touch makes the dashboard readable at a glance.
Freeze the header row (View, Freeze, 1 row) and freeze the ticker column. Now you can scroll without losing context.
Use SPARKLINE to draw a small chart inside a cell:
=SPARKLINE(GOOGLEFINANCE(A2,"price",TODAY()-30,TODAY()))
Add a Notes column. Add a Last Updated cell tied to =NOW(). Hide helper columns by right-clicking the column header.
A 30-minute polish session turns a raw GOOGLEFINANCE watchlist into a workbook that you actually open every morning.
The honest limits - where stock data in Google Sheets stops
We are big fans of Sheets. We also want to be honest about where the road ends. None of this is "Sheets is bad". It is "Sheets is amazing, and here is what it deliberately does not do".
| Need | What Sheets does | What is missing |
|---|---|---|
| Live tick-by-tick streaming | Periodic refresh on a schedule | True streaming during the session |
| Dividend yield, dividend per share | No native attribute | Income-model foundation |
| Adjusted close (splits/dividends) | Close only | Correct total-return math |
| Options chains, Greeks | Not supported | Anything beyond stock prices |
| Technical indicators (RSI, MACD) | Build manually | Single-formula indicators |
| Reliability at scale | Occasional #N/A bursts during heavy load | Stable feed for 200+ name watchlists |
| Multi-year fundamentals (revenue, ROE) | Single-point P/E and EPS only | Factor analysis, screening |
These gaps are not surprising. GOOGLEFINANCE is a free, general-purpose function tied to Google's market data layer. It is not trying to be Bloomberg. It is trying to give you a live last price in a cell, and at that it succeeds beautifully.
If you find yourself in one of the rows above with regularity, that is the signal that you have outgrown Sheets for that part of your workflow. The fix is not to fight Sheets. The fix is to add a heavier tool next to Sheets for the parts Sheets cannot do.
Where MarketXLS picks up
MarketXLS adds 1,000+ financial data functions to both Google Sheets (as an add-on from the Google Workspace Marketplace) and Excel (a Windows desktop add-in, plus a Microsoft 365 add-in for Excel on Mac and the web). Quotes come from QuoteMedia, and historical and fundamental data are served through the MarketXLS API. Quote speed follows your plan: US stock quotes are 15-minute delayed on Standard and real-time on Advanced and Business; options are end-of-day on Standard and real-time on Advanced and Business. See the MarketXLS Google Sheets page for setup.
Below is the same comparison as the table above, but with the MarketXLS formula that fills each gap.
| Need | MarketXLS formula |
|---|---|
| Streaming intraday quote (Excel, Advanced or Business plan) | =QM_Stream_Last("AAPL") |
| Dividend yield | =DividendYield("AAPL") |
| Dividend per share | =DividendPerShare("AAPL") |
| Adjusted close (split/div adjusted) | =ADJUSTED_CLOSE_HISTORICAL("AAPL", DATE(2024,1,2)) |
| Live option chain | =QM_GetOptionChainActive("AAPL") |
| Option delta | =OPT_Delta(stock, opt, exp, type, strike) |
| RSI(14) | =RelativeStrengthIndex("AAPL","14") |
| SMA 50 | =SimpleMovingAverage("AAPL","50") |
| 52-week high | =FiftyTwo_WeekHigh("AAPL") |
| Sector classification | =Sector("AAPL") |
| Earnings per share | =EarningsPerShare("AAPL") |
| Return on equity | =ReturnOnEquity("AAPL") |
| Market cap | =MarketCapitalization("AAPL") |
| Historical OHLCV | =QM_GetHistory("AAPL") |
| Live last (simple) | =QM_Last("AAPL") |
The point is coverage, not replacing Sheets. You can keep your Google Sheets workbook and add the MarketXLS add-on to fill these gaps, or use MarketXLS in Excel for heavier analysis. Check platform availability for a specific function in the formula library.
A small but illustrative example. A Sheets workbook can answer "what is AAPL trading at right now and what is the trailing P/E?" in two formulas. An Excel workbook with MarketXLS can answer the same question, plus "what is the live ATM call delta with three weeks to expiration, what was the dividend-adjusted close on the day I bought the stock, and what is the RSI(14) on the daily chart right now?" in three more.
If you do not need those answers, you do not need MarketXLS. If you do, that is the moment to add it.
Side by side - the same dashboard in both tools
Same 10-ticker watchlist, two implementations.
| Column | GOOGLEFINANCE | MarketXLS (Google Sheets add-on or Excel) |
|---|---|---|
| Last price | =GOOGLEFINANCE(A2,"price") | =QM_Last(A2) |
| Day percent change | =GOOGLEFINANCE(A2,"changepct") | =QM_Stream_PercentageChange(A2) (streaming, Excel) |
| P/E ratio | =GOOGLEFINANCE(A2,"pe") | =PERatio(A2) |
| EPS | =GOOGLEFINANCE(A2,"eps") | =EarningsPerShare(A2) |
| Beta | =GOOGLEFINANCE(A2,"beta") | =Beta(A2) |
| 52W high | =GOOGLEFINANCE(A2,"high52") | =FiftyTwo_WeekHigh(A2) |
| 52W low | =GOOGLEFINANCE(A2,"low52") | =FiftyTwo_WeekLow(A2) |
| Market cap | =GOOGLEFINANCE(A2,"marketcap") | =MarketCapitalization(A2) |
| Volume | =GOOGLEFINANCE(A2,"volume") | =Volume(A2) |
| Dividend yield | not available natively | =DividendYield(A2) |
| 50-day moving average | helper column with AVERAGE | =SimpleMovingAverage(A2,"50") |
| RSI(14) | build manually | =RelativeStrengthIndex(A2,"14") |
| Sector | not available natively | =Sector(A2) |
| Streaming live tick | not available | =QM_Stream_Last(A2) (Excel, Advanced or Business plan) |
You can build the top half with GOOGLEFINANCE alone. The rest needs MarketXLS, in Google Sheets or in Excel. In the Microsoft 365 Excel add-in (Mac and web), prefix formulas with mxls., for example =mxls.QM_Last(A2).
The free templates
Two workbooks ship with this post.
Download the templates:
- - Pre-filled values as of the publish date, plus a side-by-side reference of every GOOGLEFINANCE attribute paired with its MarketXLS equivalent.
- - Open in Excel with MarketXLS installed and the cells refresh: prices, dividends, sector, technicals, options-ready scaffolding.
Each workbook has six sheets.
- How To Use - links, references, and notes.
- GOOGLEFINANCE Reference - every attribute the function supports, with a sample formula and (in the template) the MarketXLS equivalent.
- Stock Data Dashboard - 10-name watchlist with prices, day change, moving averages, 52-week range, P/E, beta, sector.
- Fundamentals & Income - dividend yield, dividend per share, EPS, beta, sector, with portfolio-size and income-goal inputs in yellow input cells.
- When to Upgrade - the table of cases where you outgrow Sheets, paired with the MarketXLS replacement.
- Setup Checklist - the ten-step path from a fresh Google Sheet to a working dashboard, with the optional MarketXLS layer added on.
Open the static version first. It works without anything installed. The template version is for the moment you decide you want the deeper formulas.
FAQ
Is GOOGLEFINANCE real time?
No. Google documents GOOGLEFINANCE quotes as delayed up to 20 minutes, so do not treat it as tick-by-tick for active trading. For watchlists, dashboards, and longer-horizon work it is usually enough. Real-time quotes in Google Sheets are available through the MarketXLS add-on on the Advanced and Business plans.
Why does GOOGLEFINANCE return #N/A?
A few reasons. The ticker may not be in Google's coverage (less common on non-US listings, more common on small-cap or recently delisted names). The attribute may be unsupported for that asset class (for example pe on an ETF or eps on a currency pair). Sheets may also be throttling under heavy load. Try refreshing the sheet, then re-typing the formula in a fresh cell.
Can I get dividend yield in Google Sheets?
There is no native dividendyield attribute on GOOGLEFINANCE. People often compute it by hand using the annual dividend from an external source and the live price from GOOGLEFINANCE. If yield is a column you care about every day, =DividendYield("AAPL") from the MarketXLS add-on returns it directly in Google Sheets or Excel.
Can I pull options data into Google Sheets?
Not with GOOGLEFINANCE, which does not support option chains, strikes, expirations, or Greeks. With the MarketXLS Google Sheets add-on, =QM_GetOptionChain("AAPL") returns an option chain with bid, ask, volume, open interest, and implied volatility. Options data is end-of-day on the Standard plan and real-time on Advanced and Business.
Will my GOOGLEFINANCE formulas keep working forever? Google has occasionally deprecated parts of the function. It has been remarkably stable in recent years, but it is a free service tied to Google's market data layer, so the contract is whatever Google chooses to offer. If you build mission-critical infrastructure, you may want a more committed data source underneath.
Does MarketXLS work in Google Sheets? Yes. MarketXLS has a Google Sheets add-on, installed from the Google Workspace Marketplace, that runs in the browser on Mac, Windows, and Chromebook and uses the same data as the MarketXLS Excel add-in. Google Sheets uses the same pricing as regular MarketXLS. See MarketXLS for Google Sheets.
The bottom line
For basic stock data in Google Sheets, the free GOOGLEFINANCE function is often enough: price (delayed up to 20 minutes), key valuation ratios, 52-week range, and history, with no setup.
Where it ends is the part of the workflow where you start asking questions Google's free function was not designed to answer. Streaming. Dividend yield. Adjusted close. Options. Indicators. Sector classification. Multi-year fundamentals. At that point you have a choice: keep doing manual workarounds in Sheets, or layer in a tool built for those specific gaps.
MarketXLS fills those gaps as a Google Sheets add-on, so you can keep your Sheets workbook, and as an Excel add-in for Windows, Mac, and the web if you prefer Excel for the analysis layer.
Start with the free templates above. Build your Sheets watchlist this afternoon. If a month from now you keep running into the same missing pieces, take a look at the MarketXLS side. If you do not, congratulations, you have built yourself a working stock data setup for the price of a Google account.
See the full MarketXLS function library at marketxls.com or book a demo to walk through your specific workbook.