

Google Sheets cannot show true real-time streaming stock prices with its built-in function. =GOOGLEFINANCE("AAPL","price") is typically delayed by about 15 to 20 minutes for US equities and refreshes on a Google-controlled schedule, with no bid, ask, dividends, or options. The MarketXLS Google Sheets add-on adds formulas such as =Last("AAPL"), =DividendYield("AAPL"), and =QM_GetOptionChain("AAPL"), with quotes 15-minute delayed on the Standard plan and real-time on the Advanced and Business plans. For cells that update on their own every tick, MarketXLS streaming functions (=QM_Stream_Last) run in Excel desktop.
Try it in your own spreadsheet
Get the free MarketXLS sample workbook (.xlsx).
No account needed. MarketXLS live data requires a paid plan.
Explore more videos
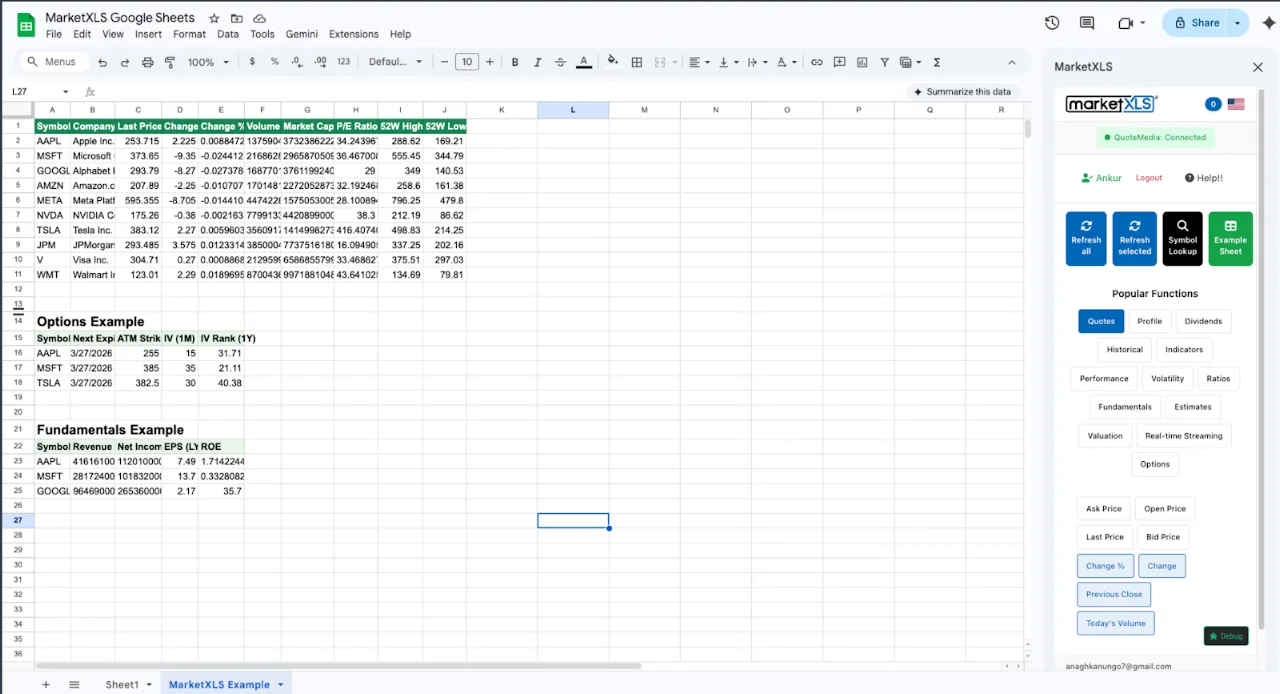
This guide shows how live each GOOGLEFINANCE attribute is, where the delay matters, and how to combine Google Sheets with a streaming feed. Two free templates at the end give you a starting point.
Real Time Stock Price Google Sheets: Attribute-by-Attribute Latency Table
The table compares each GOOGLEFINANCE attribute with the MarketXLS formula for the same field. The streaming (QM_Stream_) rows apply to Excel desktop; the on-demand formulas are the kind the MarketXLS Google Sheets add-on provides (check /formulas for platform support of each function).
| What you want | Google Sheets (GOOGLEFINANCE) | Refresh in Sheets | MarketXLS formula | Refresh model |
|---|---|---|---|---|
| Last traded price | =GOOGLEFINANCE("AAPL","price") | ~15-20 min delay on US equities, schedule-bound | =QM_Stream_Last("AAPL") | Streaming intraday |
| Snapshot last traded price | =GOOGLEFINANCE("AAPL","price") | Schedule-bound | =QM_Last("AAPL") | On-demand snapshot |
| Live bid and ask | Not available | No Level 1 quotes | =QM_Stream_Bid("AAPL"), =QM_Stream_Ask("AAPL") | Streaming intraday |
| Today open / high / low | =GOOGLEFINANCE("AAPL","priceopen") | Schedule-bound | =DayOpen("AAPL"), =DayHigh("AAPL"), =DayLow("AAPL") | On-demand |
| Volume traded today | =GOOGLEFINANCE("AAPL","volume") | Schedule-bound | =Volume("AAPL") | On-demand |
| Market capitalization | =GOOGLEFINANCE("AAPL","marketcap") | Schedule-bound | =MarketCapitalization("AAPL") | On-demand |
| Trailing P/E | =GOOGLEFINANCE("AAPL","pe") | Static | =PERatio("AAPL") | On-demand |
| Dividend yield | Not available | Coverage gap | =DividendYield("AAPL") | On-demand |
| 50 / 200-day SMA | Build manually | You compute it | =SimpleMovingAverage("AAPL","50") | On-demand |
| RSI(14) | Build manually | You compute it | =RelativeStrengthIndex("AAPL","14") | On-demand |
| Streaming intraday quote | Not supported | No live ticker | =QM_Stream_Last("AAPL") | Streaming intraday |
| Option chain | Not supported | Not available in Sheets | =QM_GetOptionChain("AAPL") | On-demand spill |
| Adjusted historical close | Not available | Close only | =ADJUSTED_CLOSE_HISTORICAL("AAPL","2024-01-02") | On-demand |
Two things stand out. First, GOOGLEFINANCE genuinely covers a long list of bread-and-butter attributes, and for most casual cases the schedule-bound refresh is good enough. Second, the moment your workflow needs streaming quotes, live bid and ask, dividends, technical indicators, or options, you are working outside what the function delivers. That is the gap this post is about.
What "Real Time" Actually Means in Google Sheets
"Real time" in a spreadsheet means one of two things. The first is current data, as in not yesterday's close. The second is a sheet that updates on its own throughout the trading session, the way a quote panel on a brokerage app does. GOOGLEFINANCE handles the first reasonably well for most US-listed tickers, with the price attribute typically delayed by around 15 to 20 minutes. It does not handle the second at all.
Google Sheets recalculates GOOGLEFINANCE on a schedule that runs when the document is open, on user actions like opening the file or editing a cell, and through indirect triggers such as a wrapper around =now() or a scheduled Apps Script. None of those are streaming. They are scheduled recalculations against a delayed source. The cell value can be fresh enough for a textbook example or a personal watchlist, but it is not a live ticker, and any workflow that depends on intraday updates needs to understand where the line falls.
For a casual watchlist of five or ten symbols glanced at a few times a day, the difference is invisible. For a 200-ticker income screen, a covered-call workflow that watches options Greeks update, or a day trader's scoreboard, the gap is the entire job. The right question to ask is not whether GOOGLEFINANCE is good or bad. It is whether the refresh model matches the workload.
What GOOGLEFINANCE Does Well
There are real strengths worth respecting before any comparison.
The formula is built in. There is nothing to install, no add-in to configure, and no authentication to manage, and it is free. For people who only need to glance at a price now and then, that is enough.
It is collaborative by default. Anyone with view access to the sheet sees the same cell with the same delayed quote. There is no second piece of software on the viewer's side. For a shared family budget, an investing club, or a teaching workbook, that simplicity is hard to beat.
It is good enough for textbook math. Beginners building portfolio examples, students working through a class spreadsheet, and personal investors with a small list of positions are well served. The Sheets product team has done a thoughtful job covering the basics.
It plays well with Sheets-native automation. Apps Script, scheduled triggers, IMPORTRANGE, and the Sheets API can all chain off a GOOGLEFINANCE column. That ecosystem is mature and free, and for a lot of lightweight personal finance use cases, the combination of a free spreadsheet and a free price feed is the complete answer.
The rest of this guide covers what to do when the schedule-bound refresh is no longer enough.
Where the Refresh Model Quietly Breaks
GOOGLEFINANCE has seven practical limits for intraday work. Some are documented, others are operational, and others only show up under load.
Schedule-bound refresh, not streaming
GOOGLEFINANCE refreshes on a Google-controlled cadence whenever the sheet is open. The price attribute typically updates faster than other attributes, but no attribute streams. The cell holds whatever value the last refresh produced until the next refresh runs. There are workarounds, including writing =GOOGLEFINANCE("AAPL","price") inside an expression that depends on =now() to force recalculation, but this only forces a recalculation against the same delayed source. It does not create a live order-book style ticker.
Frequent #N/A values during peak traffic
Multiple support threads, including Google's own Workspace forum, document outages and intermittent failures where GOOGLEFINANCE returns #N/A for hours at a time. Sometimes the price column comes back blank, sometimes it shows an error string, sometimes it returns a stale value. Any formula that depends on that cell, including totals and percentages, breaks at the same moment. There is no fallback path because there is no second source.
No live bid and ask
GOOGLEFINANCE has a price attribute but no bid or ask. For anyone who needs to estimate slippage before placing a trade, watch a tight spread widen during a news event, or model a Level 1 quote feed inside a workbook, that is a structural gap. The function simply does not expose those columns.
A short list of supported attributes
price, priceopen, high, low, volume, marketcap, pe, eps, high52, low52, beta, and a handful of others cover the basics. Anything past that, including dividend yield, sector classification, technical indicators, fundamentals beyond trailing P/E, and the entire options market, is not part of the function. You either rebuild the math yourself or move the workflow to a tool that already has the formula.
Inconsistent international coverage
US-listed equities, ETFs, mutual funds, and most major indices behave well. Step outside that, into European small caps, Indian equities, or Latin American ADRs, and coverage gets uneven. Dividend yield is the most common casualty, but volume and even the price attribute can show gaps on tickers that exist on the exchange.
No options data
GOOGLEFINANCE does not provide option chains, strikes, bids, asks, open interest, implied volatility, or Greeks. For anyone running covered calls, cash-secured puts, vertical spreads, or even simple protective puts, that is a non-starter. The fix is opening a broker tab next to the spreadsheet, which defeats the point of pulling data into a workbook in the first place.
Limited audit trail
For RIAs, family offices, and corporate finance teams, regulators and clients will sometimes ask where a number came from. GOOGLEFINANCE returns a function name and a delayed value. There is no documentation surface attached to the cell, no formula-level audit log, no obvious place to attach a footnote that travels with the workbook. For a personal investor that does not matter. For a registered firm it eventually does.
None of these are deal-breakers for casual use. All of them are deal-breakers for a workflow where the spreadsheet is part of how the business actually runs.
How MarketXLS Approaches Real-Time Quotes
MarketXLS is available as a Windows Excel add-in, a Microsoft 365 add-in for Excel on Mac and Excel for the web (formulas use the mxls. prefix), and a Google Sheets add-on. Quotes come from QuoteMedia.
MarketXLS supports two refresh models. Pull formulas like =QM_Last("AAPL") calculate on demand when you click Refresh on the MarketXLS ribbon or trigger a workbook recalculation. Streaming formulas like =QM_Stream_Last("AAPL") update intraday in Excel desktop without any user action. You choose the refresh model per cell, which means a 200-ticker screener can live on =QM_Last to stay responsive, while the four symbols you actually trade today can live on =QM_Stream_Last for live updates.
The library has 1000+ functions covering quotes, history, dividends, fundamentals, option chains and Greeks, fund data, FX, and crypto. For real-time quotes, the relevant functions are a small subset. Streaming uses one live symbol subscription per unique symbol and requires the Advanced or Business plan for real-time US stock data.
Quote primitives
=QM_Last("AAPL")           On-demand last traded price
=Last("AAPL")              Last price
=QM_Stream_Last("AAPL")       Streaming last (Excel desktop)
=QM_Stream_Bid("AAPL")        Streaming bid
=QM_Stream_Ask("AAPL")        Streaming ask
=QM_Stream_Volume("AAPL")     Streaming session volume
=DayOpen("AAPL")           Today's open
=DayHigh("AAPL")           Today's high so far
=DayLow("AAPL")            Today's low so far
=Volume("AAPL")            Today's traded volume
Formula documentation: QM_Last, Last, QM_Stream_Last, QM_Stream_Bid, QM_Stream_Ask, QM_Stream_Volume, Volume
Classification and fundamentals
=Sector("AAPL")                  Sector classification
=Industry("AAPL")                Industry classification
=MarketCapitalization("AAPL")    Market cap
=PERatio("AAPL")                 Trailing P/E
=EarningsPerShare("AAPL")        Trailing EPS
=DividendYield("AAPL")           Annual dividend yield
=DividendPerShare("AAPL")        Annual dividend per share
=Beta("AAPL")                    Beta vs benchmark
Formula documentation: Sector, Industry, MarketCapitalization, PERatio, EarningsPerShare, DividendYield, DividendPerShare, Beta
Technicals and history
=SimpleMovingAverage("AAPL","50")          50-day SMA
=SimpleMovingAverage("AAPL","200")         200-day SMA
=RelativeStrengthIndex("AAPL","14")        14-period RSI
=FiftyTwo_WeekHigh("AAPL")                 52-week high
=FiftyTwo_WeekLow("AAPL")                  52-week low
=QM_GetHistory("AAPL")                     Historical OHLCV spill
=ADJUSTED_CLOSE_HISTORICAL("AAPL","2024-01-02")
                                            Split-and-dividend adjusted close
Formula documentation: SimpleMovingAverage, RelativeStrengthIndex, FiftyTwo_WeekHigh, FiftyTwo_WeekLow, QM_GetHistory, ADJUSTED_CLOSE_HISTORICAL
Options
=QM_GetOptionChain("AAPL")           Active option chain spill
=QM_GetOptionChainAtTheMoney("AAPL")       ATM contracts only
=QM_GetOptionChainWeeklies("AAPL")         Weekly expirations
=OPT_Delta(StockPrice, OptionPrice, Expiry, Type, Strike)
=OPT_Gamma(StockPrice, OptionPrice, Expiry, Type, Strike)
=OPT_Theta(StockPrice, OptionPrice, Expiry, Type, Strike)
=OPT_Vega(StockPrice, OptionPrice, Expiry, Type, Strike)
Formula documentation: QM_GetOptionChain, QM_GetOptionChainAtTheMoney, QM_GetOptionChainWeeklies, OPT_Delta, OPT_Gamma, OPT_Theta, OPT_Vega
These formulas are not built to replace GOOGLEFINANCE for the casual case. They exist to cover the gaps that show up the moment a workflow needs streaming quotes, options, full fundamentals, or audit-friendly references.
A Two-Zone Real-Time Workbook Pattern
A pattern that works well for advisors, finance teams, and active investors is a single Excel workbook with two zones.
The top zone is an on-demand dashboard built on formulas like =QM_Last(A8), =DayOpen(A8), =Volume(A8), =PERatio(A8), =DividendYield(A8), and =Sector(A8). You can put hundreds of rows in this zone without worrying about a streaming connection trying to update them every second. Refresh runs when you click Refresh on the MarketXLS ribbon, which means the workbook stays responsive even when the watchlist is large.
The bottom zone is a streaming block built on =QM_Stream_Last(A22), =QM_Stream_Bid(A22), =QM_Stream_Ask(A22), and =QM_Stream_Volume(A22). This is the small group of symbols you are actually watching live in the current session, typically four to ten tickers. Streaming formulas update intraday without any user action on Excel desktop, which is the closest thing to a broker-style ticker that fits inside a spreadsheet.
The downloadable templates at the end of this post are laid out exactly that way. A ten-ticker on-demand dashboard for the broad watchlist, a five-ticker streaming block for the symbols you trade actively, a side-by-side mapping of every GOOGLEFINANCE attribute to its MarketXLS equivalent, an allocation sheet sized from live prices, and a refresh-scenarios sheet that walks through the cases where the delay actually hurts.
A Practical Workflow for Investors Already in Google Sheets
You do not have to abandon Google Sheets to add a real-time layer. The pragmatic approach is to use each tool where it shines and stop forcing one to do the other's job.
Step 1: Inventory your GOOGLEFINANCE cells
Open your existing Sheets file, use the Find and Replace panel with the regular-expression option, and search for GOOGLEFINANCE. Count how many distinct attributes appear. In practice, most workbooks use four or five attributes repeated across many rows, and the inventory takes a few minutes.
Step 2: Map attributes to MarketXLS formulas
Use the comparison table earlier in this post, or the dedicated Google Sheets vs MarketXLS tab inside the template, to translate each attribute. Most cases are direct one-to-one swaps. A small number of attributes have no GOOGLEFINANCE equivalent at all, which is the point.
Step 3: Stand up the on-demand dashboard in Excel
Open an Excel workbook with MarketXLS installed. Set up a column with your tickers, then a =QM_Last(A2) column, then any other formulas you want. Excel and MarketXLS resolve the values when you click Refresh on the ribbon. Each formula replaces what used to be a multi-cell construction in Sheets, so the rebuild is usually faster than the original.
Step 4: Add the streaming block
Identify the symbols you actively monitor during the session, usually a small subset of the full watchlist, and add =QM_Stream_Last, =QM_Stream_Bid, and =QM_Stream_Ask columns. These update intraday on Excel desktop without manual refresh and give you the closest thing to a live scoreboard inside a spreadsheet.
Step 5: Layer in fundamentals and technicals
Add a column for dividend yield, another for 50-day SMA, another for RSI(14), another for beta. Each is a single formula. Compare side by side with what you used to maintain manually in Sheets, and a fair number of multi-row constructions collapse into a single cell.
Step 6: Add options if relevant
If you sell covered calls, run cash-secured puts, or hedge with protective puts, drop =QM_GetOptionChain(Ticker) on a separate sheet. The active chain spills below the formula. Pair that with =OPT_Delta and the rest of the Greeks library for per-contract analytics, and the workbook now covers a layer of the market that GOOGLEFINANCE never touches.
Step 7: Document on a How To Use tab
Keep a How To Use tab in the workbook listing the formulas, the source of the data, and the refresh model. When a regulator, partner, or client asks where a number came from, you have an answer that lives inside the workbook itself. The downloadable template includes a starter version of this tab you can reuse.
Cost, Coverage, and the Pricing Question
MarketXLS is a paid product and GOOGLEFINANCE is free. US plans for non-professional users are Standard ($70/month billed annually, 15-minute delayed stock quotes), Advanced ($125/month billed annually, real-time streaming stocks and options), and Business ($200/month billed annually). The Google Sheets add-on uses the same pricing. Weigh that against the hours spent rebuilding moving averages by hand, debugging #N/A gaps, and copying option data from a broker tab. For a student project, GOOGLEFINANCE is enough.
For current plans, see the MarketXLS pricing page. To see the product run against your exact watchlist before deciding, you can book a demo.
Download the Templates
Download the templates:
- - Pre-filled snapshot values plus the formula reference. Good for previewing layout before installing MarketXLS.
- - Live
=QM_Last,=QM_Stream_Last,=QM_Stream_Bid,=QM_Stream_Ask,=DividendYield,=PERatio, and=Sectorformulas across six sheets.
Both files include:
- A Real Time Dashboard with a ten-ticker on-demand watchlist and a five-ticker streaming block
- A Google Sheets vs MarketXLS reference tab listing every attribute and its refresh model side by side
- A Portfolio Allocation sheet driven by live prices, sized from a portfolio input cell
- A Refresh Scenarios sheet describing where GOOGLEFINANCE goes stale and what MarketXLS returns instead
- A Setup Checklist for migrating a Google Sheets workbook to a MarketXLS real-time dashboard
- A How To Use overview with links to marketxls.com, book a demo, and pricing
Every sheet ends with a "MarketXLS Functions Used in This Sheet" box listing the exact formulas referenced on that tab, so users can copy the patterns into their own workbooks.
FAQ
How real time is GOOGLEFINANCE in Google Sheets?
GOOGLEFINANCE values for US equities are typically delayed by about 15 to 20 minutes on the price attribute, refreshed on a Google-controlled schedule whenever the sheet is open. That is current enough for many investing decisions but is not real time. For intraday streaming inside a spreadsheet, MarketXLS exposes =QM_Stream_Last(Symbol) in Excel desktop on the Advanced or Business plan, which updates without user action.
Can I get real time stock prices in Google Sheets at all?
Yes, through an add-on. The MarketXLS Google Sheets add-on returns quotes with formulas like =Last("AAPL"), real-time on the Advanced and Business plans and 15-minute delayed on Standard; values update when the sheet recalculates. For cells that stream tick by tick, use MarketXLS streaming formulas in Excel desktop. The downloadable template shows a two-zone pattern for that.
What is the difference between =QM_Last and =QM_Stream_Last in MarketXLS?
=QM_Last("AAPL") is an on-demand snapshot, calculated when you click Refresh on the MarketXLS ribbon or trigger a workbook recalculation. It is ideal for large watchlists where you do not want every cell trying to update at the same time. =QM_Stream_Last("AAPL") is a streaming formula, updating intraday on Excel desktop without user action. The recommended pattern is to use =QM_Last for the broad dashboard and =QM_Stream_Last only for the handful of symbols you actively watch.
Does GOOGLEFINANCE return live bid and ask prices?
No. GOOGLEFINANCE exposes a price attribute but no bid or ask. For Level 1 quotes inside a spreadsheet, the available path on Excel desktop is =QM_Stream_Bid(Symbol) and =QM_Stream_Ask(Symbol) from MarketXLS.
How do I avoid #N/A errors in GOOGLEFINANCE during peak hours?
The most common workaround is wrapping the formula in =IFERROR(GOOGLEFINANCE(...), fallback), which prevents downstream cells from breaking but does not give you a live value during the outage. If a workflow cannot tolerate intermittent gaps, the practical answer is a redundant data source, which in practice means a paid feed or moving the dashboard into a different tool entirely.
Can MarketXLS run inside Google Sheets?
Yes. MarketXLS has a Google Sheets add-on, installed from the Google Workspace Marketplace, that adds quote, fundamental, dividend, and options formulas to Sheets (Google Sheets page). Streaming QM_Stream_ formulas described in this post run in Excel desktop. Some functions differ by platform, so check /formulas.
What MarketXLS formulas replace GOOGLEFINANCE for live quotes?
The most common mappings are =GOOGLEFINANCE("AAPL","price") to =QM_Last("AAPL") or =QM_Stream_Last("AAPL") for streaming, =GOOGLEFINANCE("AAPL","high52") to =FiftyTwo_WeekHigh("AAPL"), =GOOGLEFINANCE("AAPL","beta") to =Beta("AAPL"), =GOOGLEFINANCE("AAPL","pe") to =PERatio("AAPL"), and =GOOGLEFINANCE("AAPL","marketcap") to =MarketCapitalization("AAPL"). The comparison tab inside the downloadable template lists more than twenty pairings.
Is there an options-data function for Google Sheets?
Not natively. GOOGLEFINANCE has no option chain attribute. MarketXLS exposes =QM_GetOptionChain(Ticker), =QM_GetOptionChainAtTheMoney(Ticker), and =QM_GetOptionChainWeeklies(Ticker) as spill arrays, along with per-leg Greeks via =OPT_Delta, =OPT_Gamma, =OPT_Theta, and =OPT_Vega on Excel desktop.
The Bottom Line
GOOGLEFINANCE gives Google Sheets delayed prices that work for casual use. It does not stream, does not expose bid or ask, does not provide dividend yields outside a narrow set of tickers, does not include technical indicators, options chains, Greeks, or audit-friendly references. None of those are obscure asks. They are the daily work of advisors, finance teams, and active investors.
For most readers, the practical setup is to keep Google Sheets for casual watchlists and collaborative dashboards, add the MarketXLS Google Sheets add-on for dividends, fundamentals, and options data, and use MarketXLS in Excel for tick-by-tick streaming. The free templates above are a working example you can install, point at your own tickers, and rebuild around your own portfolio and the questions you actually need answered.
For more on MarketXLS and what it can do inside Excel, visit marketxls.com or book a demo to see the streaming formulas run against your specific watchlist.
Educational content only. Nothing in this post is investment advice. Tickers shown are illustrative.
