

S&P 500 on Google Finance can be found using the ticker symbol .INX. Just go to google.com/finance and search for .INX or "S&P 500" — you'll see the current index value, a price chart, and basic market data.
Try it in your own spreadsheet
Get the free MarketXLS sample workbook (.xlsx).
No account needed. MarketXLS live data requires a paid plan.
Explore more videos
If you need the S&P 500 in Google Sheets, the formula is:
=GOOGLEFINANCE("INDEXSP:.INX")
That's the quick answer. Below, we cover everything else: how to get historical data, what Google Finance can and can't do, and when you need something more powerful.
How to Find the S&P 500 on Google Finance
On the Website
- Go to google.com/finance
- Search for
.INXor "S&P 500" - You'll see the current value, daily change, and an interactive chart
The full ticker on Google Finance is INDEXSP:.INX, where:
- INDEXSP = the exchange (S&P Indices)
- .INX = the ticker symbol for the S&P 500
In Google Sheets
Use the GOOGLEFINANCE function to pull live data directly into a cell:
=GOOGLEFINANCE("INDEXSP:.INX")
This returns the current S&P 500 value. You can also pull specific attributes:
| Formula | What It Returns |
|---|---|
=GOOGLEFINANCE("INDEXSP:.INX") | Current index value |
=GOOGLEFINANCE("INDEXSP:.INX", "price") | Same as above |
=GOOGLEFINANCE("INDEXSP:.INX", "high") | Today's high |
=GOOGLEFINANCE("INDEXSP:.INX", "low") | Today's low |
=GOOGLEFINANCE("INDEXSP:.INX", "volume") | Trading volume |
=GOOGLEFINANCE("INDEXSP:.INX", "close", DATE(2024,1,2), DATE(2024,12,31)) | Historical closing prices |
Getting Historical S&P 500 Data in Google Sheets
To pull a range of historical prices:
=GOOGLEFINANCE("INDEXSP:.INX", "close", DATE(2024,1,1), TODAY(), "DAILY")
This returns a two-column array with dates and closing values. You can change "DAILY" to "WEEKLY" for weekly data.
What Google Finance Gives You (and What It Doesn't)
Google Finance is great for a quick check. It's free, it's fast, and it covers the basics. But it has real limitations:
What Google Finance does well:
- ✅ Free live quote for the S&P 500
- ✅ Basic interactive chart
- ✅ Simple historical data via Google Sheets
- ✅ Quick comparison with other indices
Where Google Finance falls short:
- ❌ No real-time streaming — data is delayed 15-20 minutes
- ❌ No options data — can't see SPX or SPXW option chains
- ❌ No fundamentals — no P/E ratios, earnings, or financial statements for index components
- ❌ No technical indicators — no RSI, MACD, Bollinger Bands
- ❌ Limited export — can't easily build models around the data
- ❌ Unreliable API —
GOOGLEFINANCEbreaks frequently and has known bugs with historical data
If all you need is a quick glance at where the S&P 500 is trading, Google Finance works. But if you're doing any actual analysis, you'll hit its limits fast.
A Better Way: S&P 500 Data in Google Sheets or Excel with MarketXLS
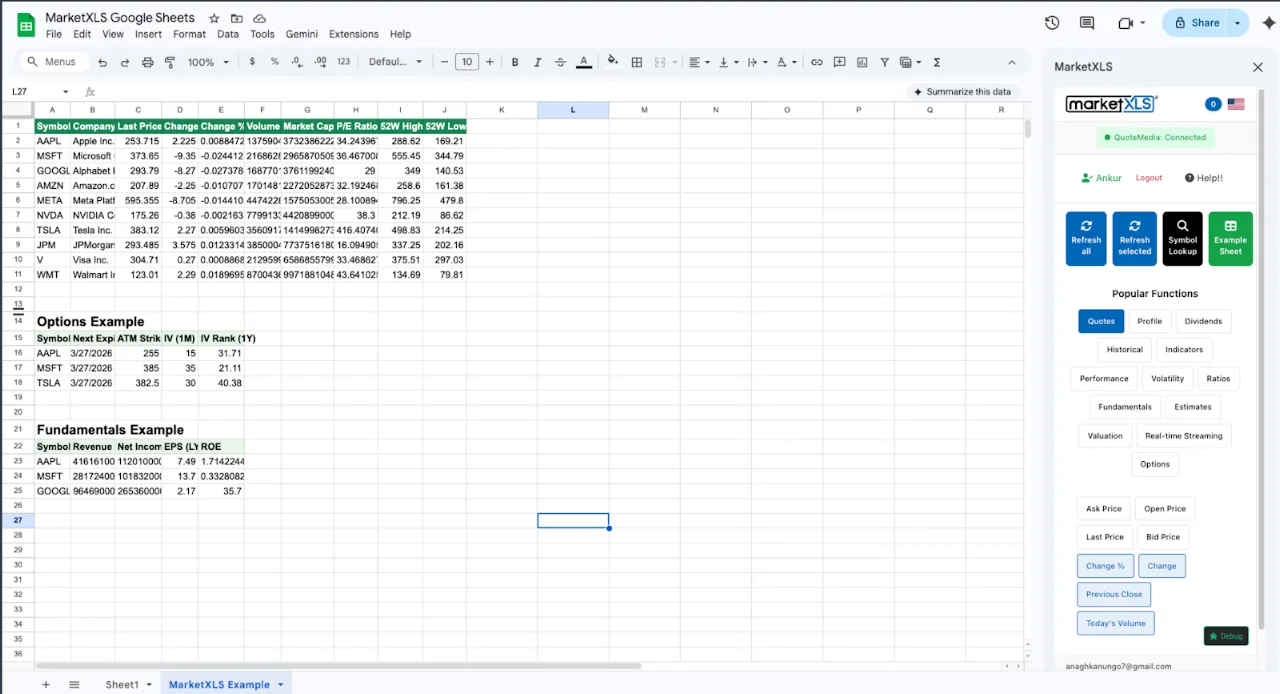
MarketXLS adds market data functions to Google Sheets and Excel without web scraping. For indices such as the S&P 500, data is on demand on the Standard plan, end-of-day on Advanced, and real-time on Business. You can install MarketXLS for Google Sheets or use the Excel add-in. Here is how it compares for S&P 500 data:
Get the Live S&P 500 Price
=Last("^SPX")
Formula documentation: Last
Returns the S&P 500 value in Google Sheets or Excel, at your plan's data speed for indices (real-time on the Business plan).
Get Historical S&P 500 Prices
=QM_GetHistory("^SPX")
Formula documentation: QM_GetHistory
Pull historical prices into your spreadsheet. Build your own charts and models without the GOOGLEFINANCE reliability issues.
Track S&P 500 Components
=Last("AAPL")
=hf_revenue("MSFT", 2024)
=QM_Last("GOOGL")
Formula documentation: Last, hf_revenue, QM_Last
Get prices and detailed fundamentals, such as historical revenue, for all 500 components. GOOGLEFINANCE returns component prices and a few ratios, but not financial statement data.
Analyze SPX Options
=QM_GetOptionChain("^SPX")
Formula documentation: QM_GetOptionChain
Pull the full SPX option chain directly into Google Sheets or Excel. Google Finance offers zero options data.
Technical Analysis
=RSI("^SPX")
=SimpleMovingAverage("^SPX", 50)
=MACD("^SPX")
Formula documentation: RSI, SimpleMovingAverage
Calculate technical indicators directly as formulas in Google Sheets or Excel. No scripts, no manual calculations.
Google Finance vs MarketXLS — Side by Side
| Feature | Google Finance | MarketXLS |
|---|---|---|
| S&P 500 live price | ✅ (delayed up to 20 min) | ✅ (real-time on Business plan; on demand on Standard) |
| Historical prices | ✅ (via Google Sheets, unreliable) | ✅ (reliable, any date range) |
| Options data | ❌ | ✅ (full chain, Greeks, pricing) |
| Fundamental data | ❌ | ✅ (1,000+ functions) |
| Technical indicators | ❌ | ✅ (RSI, MACD, SMA, etc.) |
| Works in | Google Sheets | Excel (Windows, Mac, web) and Google Sheets |
| Cost | Free | From $70/month |
| Data source | QuoteMedia quotes; licensed fundamentals |
Other S&P 500 Ticker Symbols by Platform
Different platforms use different symbols for the S&P 500. Here's a quick reference:
| Platform | Ticker Symbol |
|---|---|
| Google Finance | .INX or INDEXSP:.INX |
| Yahoo Finance | ^GSPC |
| MarketXLS | ^SPX |
| Bloomberg | SPX Index |
| TradingView | SPX |
| Thinkorswim | SPX or /ES (futures) |
Frequently Asked Questions
What is the S&P 500 ticker on Google Finance?
The S&P 500 ticker on Google Finance is .INX. In Google Sheets, use INDEXSP:.INX with the GOOGLEFINANCE function.
Why isn't GOOGLEFINANCE working for the S&P 500?
The GOOGLEFINANCE function is known to break periodically. Google does not officially support it as a product, and the data feed can be unreliable. If you need dependable data, consider using MarketXLS in Google Sheets or Excel instead.
Is Google Finance data real-time?
No. Google Finance shows delayed data, typically up to 20 minutes behind the market. For real-time S&P 500 index data you need a data provider; with MarketXLS, real-time index data is included in the Business plan.
Can I get S&P 500 options data on Google Finance?
No. Google Finance does not provide options data for any security. To analyze SPX or SPXW options, you'll need a platform like MarketXLS that supports full option chain retrieval.
How do I track the S&P 500 in Google Sheets or Excel?
Use MarketXLS with the formula =Last("^SPX") for the live price, or =QM_GetHistory("^SPX") for historical data. MarketXLS provides 1,000+ functions for financial data in Google Sheets and Excel.
Summary
The S&P 500 on Google Finance uses the ticker .INX — search for it on the website or use =GOOGLEFINANCE("INDEXSP:.INX") in Google Sheets. It's free and works for basic lookups.
For options analysis, technical indicators, fundamentals, or models, MarketXLS adds those as formulas in Google Sheets or Excel, starting with =Last("^SPX"). Install MarketXLS for Google Sheets to get started.
