

Google Sheets already includes a free market data function, GOOGLEFINANCE, which returns delayed prices, basic attributes (P/E, EPS, market cap, beta, 52-week range), and daily price history. It does not return option chains, dividend details such as payout ratio, financial statements, technical indicators, sector tags, or ETF holdings. For those, a market data add-on such as MarketXLS adds named functions to Google Sheets (and to Excel), for example =PayoutRatio("KO"), =RSI("AAPL"), and =QM_GetOptionChainActive("AAPL"). MarketXLS for Google Sheets uses the same pricing as regular MarketXLS.
Try it in your own spreadsheet
Get the free MarketXLS sample workbook (.xlsx).
No account needed. MarketXLS live data requires a paid plan.
Explore more videos
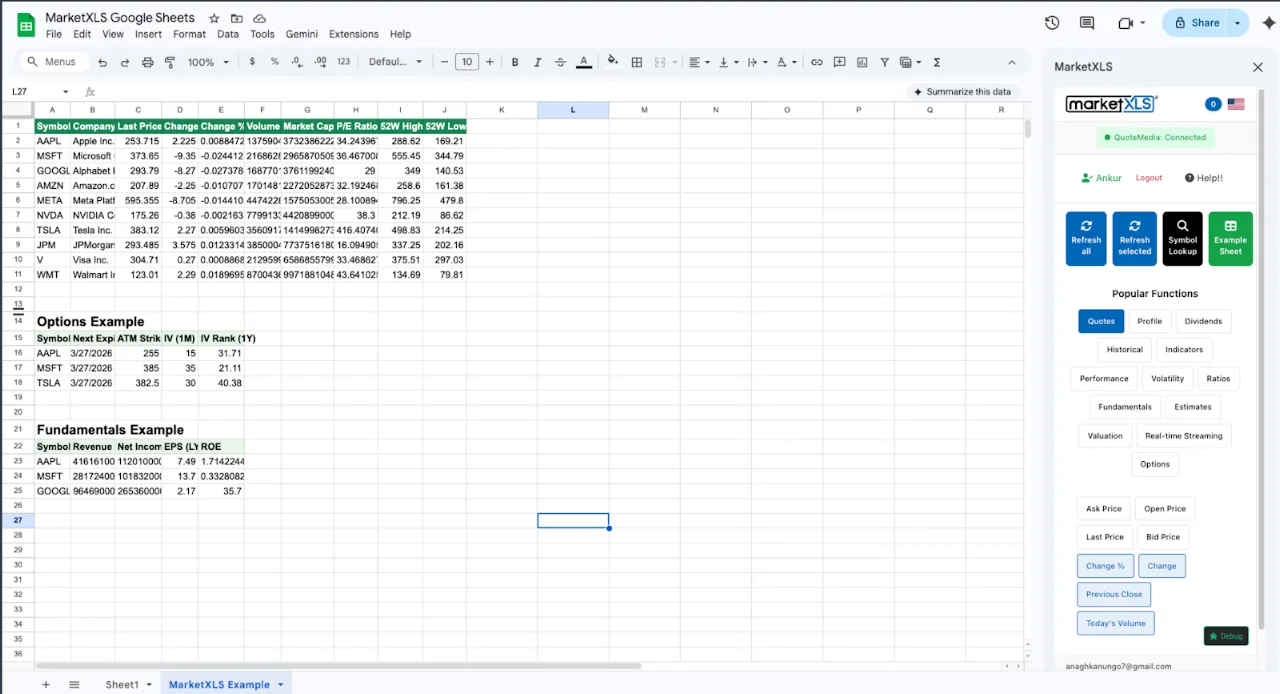
This guide shows what GOOGLEFINANCE does well, where it stops, and which MarketXLS formulas cover each gap. A sample workbook and a live template are at the bottom.
GOOGLEFINANCE vs MarketXLS At a Glance
| Capability | GOOGLEFINANCE (Google Sheets) | MarketXLS |
|---|---|---|
| Live stock last price | Yes | Yes (=QM_Last) |
| Open / high / low / close / volume | Yes | Yes |
| Daily historical prices | Yes ("history" attribute) | Yes (=QM_GetHistory) |
| Intraday minute bars | Limited | Yes (=QM_GetMinuteData) |
| 52-week high and low | Yes | Yes (=FiftyTwoWeekHigh, =FiftyTwoWeekLow) |
| Market cap, P/E, EPS | Yes (basic) | Yes (plus 1,000+ deeper functions) |
| Dividend yield and payout history | Limited | Yes (=DividendYield, =DividendPerShare, =PayoutRatio) |
| Forward dividend yield, 5-year averages | No | Yes (=ForwardAnnualDividendYield, =FiveYearAverageDividendYield) |
| Sector, industry, business description | No | Yes (=Sector, =Industry, =Description) |
| Full income statement and balance sheet | No | Yes (=Revenue, =NetIncome, =TotalAssets) |
| 10-year financial history | No | Yes |
| Technical indicators (SMA, RSI, MACD) | No | Yes (=SimpleMovingAverage, =RSI, =MACD) |
| Beta | Yes ("beta" attribute) | Yes (=Beta) |
| Historical volatility | No | Yes (=QM_Volatility) |
| Full live option chain | No | Yes (=QM_GetOptionChainActive) |
| Greeks and implied volatility | No | Yes (=OPT_Delta, =ImpliedVolatility) |
| Black-Scholes pricing engine | No | Yes (=BlackScholesOptionValue) |
| ETF holdings and AUM | No | Yes (=FundHoldings, =FundNetAssets) |
| Streaming prices in Excel | No (Sheets only) | Yes (=QM_Stream_Last, Advanced and Business plans) |
| Refresh-on-demand in Google Sheets | Yes | Yes (MarketXLS Google Sheets add-on) |
| Total functions available | About a dozen attributes | 1,000+ |
For prices and basic ratios, both work. For options, dividends, fundamentals, technicals, and ETF data, only MarketXLS returns a value.
Google Finance Is the Right First Stop
GOOGLEFINANCE is the right first stop because it needs no setup. There is no add-on to install, no API key to manage, no account to create. You open a Google Sheet and type =GOOGLEFINANCE("AAPL") and a number appears. That experience matters.
A few things GOOGLEFINANCE genuinely nails:
Zero friction. Anyone with a Google account can build a watchlist in two minutes. For new investors learning what a P/E ratio is, or for a financial literacy class, this is exactly the right tool.
Built into the sheet. Because the function is native, every collaborator on the document can see the same formulas without authorizing anything. That is a real advantage for shared spreadsheets used by clubs, study groups, or small teams.
A reasonable spread of attributes. The second argument to GOOGLEFINANCE accepts a list of attributes that covers most "give me one number" use cases: price, priceopen, high, low, volume, marketcap, tradetime, datadelay, volumeavg, pe, eps, high52, low52, change, beta, changepct, closeyest, shares, currency. For a personal tracker, that is a long list.
Daily history works. =GOOGLEFINANCE("AAPL","price",DATE(2025,1,1),DATE(2025,12,31),"DAILY") returns a real two-column block of dates and closes. Pair that with charts and you have a decent retrospective tool.
Currencies and indices. =GOOGLEFINANCE("CURRENCY:EURUSD") and =GOOGLEFINANCE(".INX") both return what you would expect. Mutual fund quotes are supported on the same attribute model.
If your workflow stops at "what is AAPL doing today, what did it close at last Friday, and what was the year-end value of my watchlist," you can stay in Google Sheets and you are not missing anything.
Where the Built-In Add-On Quietly Stops
Once you push past the surface, you start seeing the edges. None of these are bugs. GOOGLEFINANCE was scoped to a particular job and it does that job. The list below is just an honest map of the territory beyond.
No options data at all. Type any option symbol or any attribute that hints at options into GOOGLEFINANCE and you get an empty cell or an error. There is no chain, no strike, no expiration, no Greek, no implied volatility. If you trade options or even just want to monitor implied volatility, this is the wall.
Limited dividend depth. GOOGLEFINANCE can return the most recent ex-dividend information indirectly, but there is no clean attribute for trailing yield, payout ratio, 5-year dividend growth, forward annual dividend, or dividend frequency. Income investors quickly outgrow it.
No real fundamentals. EPS and P/E are there. Revenue, net income, total assets, debt-to-equity, return on equity, free cash flow, operating margin, gross margin - none of those are exposed. You cannot screen on quality metrics from inside the sheet.
No technical indicators. A 50-day simple moving average, a 14-day RSI, a MACD line, a Bollinger band - all of these require you to pull daily history into a separate range and compute them by hand with formulas. That works for one ticker, but it gets fragile and slow with a watchlist of 30 names.
No sector or industry tags. You cannot color-code a watchlist by sector or filter by industry without manually maintaining a lookup column.
No streaming. GOOGLEFINANCE refreshes on a delay and only inside Google Sheets. It does not exist in Excel.
No ETF transparency. Top holdings, AUM, expense ratio, holdings-weighted yield - all of this is missing.
None of these limits make GOOGLEFINANCE bad. They simply mark the edge of what a free, generalized attribute lookup can practically deliver.
Where MarketXLS Picks Up
MarketXLS is a market data add-on for Google Sheets and Excel. It covers the GOOGLEFINANCE basics and adds 1,000+ functions for dividends, fundamentals, technicals, options, and ETFs. On the Standard plan, US stock quotes are 15-minute delayed and options are end-of-day; the Advanced and Business plans stream real-time stock and options data.
Stock Quotes That Match What GOOGLEFINANCE Returns
=QM_Last("AAPL")                  Apple last traded price
=QM_Last("MSFT")                  Microsoft last traded price
=QM_Volume("AAPL")                Today's volume
=FiftyTwoWeekHigh("AAPL")         52-week high
=FiftyTwoWeekLow("AAPL")          52-week low
=PERatio("AAPL")                  Trailing P/E
=EarningsPerShare("AAPL")         Trailing EPS
=MarketCapitalization("AAPL")     Market cap in dollars
Formula documentation: QM_Last, QM_Volume, FiftyTwoWeekHigh, FiftyTwoWeekLow, PERatio, EarningsPerShare, MarketCapitalization
These are the direct analogues of the most common GOOGLEFINANCE attributes. The syntax is closer to "what data point do I want" rather than "what string attribute do I pass," which tends to be easier to read when you come back to a sheet six months later.
Dividends, Properly
=DividendYield("KO")                  Trailing dividend yield
=DividendPerShare("KO")               Last 12 months dividend per share
=ForwardAnnualDividendYield("KO")     Forward yield based on next 12 months
=PayoutRatio("KO")                    Dividend / earnings ratio
=FiveYearAverageDividendYield("KO")   5-year average yield
Formula documentation: DividendYield, DividendPerShare, ForwardAnnualDividendYield, PayoutRatio, FiveYearAverageDividendYield
For income-focused investors, this is the layer that GOOGLEFINANCE does not cover. You can build a real dividend safety screener with payout ratios and growth, not just an unannotated yield number.
Fundamentals For Real Screening
=Revenue("AAPL")                Trailing 12-month revenue
=NetIncome("AAPL")              Trailing 12-month net income
=OperatingMargin("AAPL")        Operating margin
=ReturnOnEquity("AAPL")         Return on equity
=TotalDebtToEquity("AAPL")      Debt / equity ratio
=CashFlowPerShare("AAPL")       Cash flow per share
=Sector("AAPL")                 Sector tag
=Industry("AAPL")               Industry tag
=Description("AAPL")            Business description
Formula documentation: Revenue, OperatingMargin, ReturnOnEquity, TotalDebtToEquity, CashFlowPerShare, Sector, Industry
Now your watchlist can include columns that GOOGLEFINANCE simply does not expose. You can also pull historical versions of these for trend analysis, which makes the spreadsheet useful for long-horizon analysis rather than just a daily price snapshot.
Technical Indicators Without Manual Math
=SimpleMovingAverage("AAPL",50)         50-day SMA
=SimpleMovingAverage("AAPL",200)        200-day SMA
=ExponentialMovingAverage("AAPL",21)    21-day EMA
=RSI("AAPL")                            14-day RSI
=MACD("AAPL")                           MACD line
=Beta("AAPL")                           Beta vs market
=QM_Volatility("AAPL")                  Historical volatility
Formula documentation: SimpleMovingAverage, ExponentialMovingAverage, RSI, Beta
A 50-over-200 trend filter or an RSI-based watchlist becomes a one-formula-per-cell exercise instead of a 100-row computation.
Options - The Single Biggest Gap
This is where Google Sheets' built-in add-on goes silent and MarketXLS does the most differentiated work:
=QM_GetOptionChainActive("AAPL")        Full active option chain spill
=QM_GetOptionChainAtTheMoney("AAPL")    ATM strikes only
=QM_GetOptionChainNearTerm("AAPL")      Nearest expiration
=ImpliedVolatility("AAPL")              30-day at-the-money IV
=ImpliedVolatilityRank1Y("AAPL")        IV rank over the trailing year
=OPT_Delta(Stock,Option,Expiry,"Call",Strike)
=OPT_Gamma(...)                         Same signature for gamma
=OPT_Theta(...)                         Theta
=OPT_Vega(...)                          Vega
=BlackScholesOptionValue(OptionSymbol)  Theoretical price
Formula documentation: QM_GetOptionChainActive, QM_GetOptionChainAtTheMoney, QM_GetOptionChainNearTerm, ImpliedVolatility, ImpliedVolatilityRank1Y, OPT_Delta, OPT_Gamma, OPT_Theta, OPT_Vega, BlackScholesOptionValue, OptionSymbol
If you trade covered calls or cash-secured puts, monitor IV rank, or look at unusual options activity, this is the layer where GOOGLEFINANCE has no equivalent at all.
ETFs
=FundHoldings("XLE")            Top holdings list
=FundNetAssets("XLE")           ETF AUM
=FundExpenseRatio("XLE")        Expense ratio
=FundFamily("XLE")              Fund family
Formula documentation: FundHoldings, FundNetAssets, FundExpenseRatio, FundFamily
These functions return fund cost, size, and holdings, which GOOGLEFINANCE does not expose.
A Side-by-Side Example
Suppose you want a 30-name dividend watchlist with these columns: ticker, name, last price, P/E, dividend yield, payout ratio, 5-year dividend growth, sector, and a flag if the 50-day SMA is above the 200-day SMA.
In Google Sheets with GOOGLEFINANCE alone, you can fill the first four columns and that is roughly it. Dividend yield is technically available through an indirect chain of formulas, payout ratio is not, 5-year dividend growth is not, sector is not, and SMAs require pulling daily history and computing them manually for every ticker.
The same watchlist in either Excel with MarketXLS or Google Sheets with the MarketXLS add-on becomes a single row of formulas per ticker that fills every column. Nothing exotic - just direct named functions where the built-in tool stops.
That is the practical difference. GOOGLEFINANCE is a great first three columns of a watchlist. MarketXLS is the rest of the sheet.
When Should You Stay With GOOGLEFINANCE?
A few honest cases where the built-in tool is the right answer:
You only track prices. If your spreadsheet is a personal watchlist or a basic position tracker that never goes deeper than last price, P/E, and yield, GOOGLEFINANCE is exactly enough and it is free.
Everything must be inside Google Sheets, shared with people who will not authorize anything. GOOGLEFINANCE works for any viewer of the document with no setup. A third party add-on adds friction even if it is small.
You are teaching basics. For a finance class, a personal finance workshop, or onboarding a teenager to investing concepts, the simplicity of GOOGLEFINANCE is a feature, not a limitation.
You never trade options and never need fundamentals. The lower the depth, the better GOOGLEFINANCE fits.
If any of those describe you, save yourself the complexity. Stay in Google Sheets.
When MarketXLS Becomes the Better Fit
The transition point usually comes from one of these triggers:
You started doing dividend analysis. Once you care about payout ratio, dividend growth, forward yield, or building a dividend safety screener, GOOGLEFINANCE runs out of attributes.
You started thinking about options. Even one covered call workflow per month is enough to outgrow the built-in tool. Once you want strikes, expirations, Greeks, or IV rank, there is no in-Sheets workaround.
You want fundamentals you can screen on. Revenue, net income, free cash flow, return on equity, debt-to-equity - the moment your spreadsheet has a quality column, GOOGLEFINANCE no longer fits.
You want technical indicators without DIY math. SMA, EMA, RSI, MACD, Bollinger bands, beta, volatility - they should each be one formula, not a 200-row computation per ticker.
You moved to Excel desktop. GOOGLEFINANCE does not exist outside Sheets. If your workflow is in Excel, the question is not whether to use a market data add-in; it is which one.
You have a list of more than about 20 tickers. Watchlists scale better when each column is a single named function. GOOGLEFINANCE attribute strings become harder to manage at scale.
In all of those cases, MarketXLS extends the same spreadsheet idea instead of replacing it. You still type formulas. The formulas just go deeper.
How MarketXLS Plugs Into Google Sheets and Excel
MarketXLS supports both environments:
Excel on Windows. The MarketXLS desktop add-in adds a "MarketXLS" ribbon tab and the 1,000+ function library, including streaming functions such as =QM_Stream_Last("AAPL") that update automatically during market hours on the Advanced and Business plans.
Excel on Mac and Excel for the web. The Microsoft 365 add-in, installed from Microsoft AppSource, uses the same MarketXLS account. Formulas take the mxls. prefix, for example =mxls.Last("MSFT").
Google Sheets. The MarketXLS Google Sheets add-on brings the function library into Sheets. Streaming is not available in Sheets; values update when the sheet recalculates.
Function availability can differ by platform, so check /formulas before moving a workbook between Sheets and Excel.
For setup steps see MarketXLS for Google Sheets or choose your MarketXLS version, or the broader Excel add-in feature page.
The Template - What You Get
The download below includes two workbooks:
Sample workbook - Static values pre-filled as of 2026-05-13. Every cell shows the MarketXLS formula that would generate it live, so you can see exactly which function corresponds to which number. Six sheets:
- How To Use - overview, formula reference, links.
- Stock Dashboard - watchlist of 12 names with price, market cap, P/E, dividend yield, beta, sector, and the GOOGLEFINANCE equivalent shown next to each row so you can compare.
- Dividend Tracker - 8 dividend payers with TTM yield, dividend per share, payout ratio, forward yield, 5-year growth, and frequency.
- Historical Prices - daily AAPL series with 52-week high/low.
- Technical Signals - 8-ticker scoreboard with 50-day SMA, 200-day SMA, RSI, MACD, and beta.
- GOOGLEFINANCE vs MarketXLS - capability-by-capability side-by-side table.
Live MarketXLS template - Same six sheets, but every data cell is a live MarketXLS formula. Drop your own tickers into the watchlist and every column populates. Use it in Excel desktop with the MarketXLS add-in or inside Google Sheets with the MarketXLS Google Sheets add-on.
Yellow cells are inputs. Everything else is calculated or fetched. Sheets are frozen at the header so scrolling through a long watchlist stays readable.
Download the templates:
- - Pre-filled with data as of 2026-05-13
- - Live-updating formulas
FAQ
Is GOOGLEFINANCE good enough for personal investing?
For many personal investors, yes. If your needs stop at price, P/E, the 52-week range, and daily history, GOOGLEFINANCE is sufficient. Investors who need fundamentals, options, dividend detail, or technical signals outgrow it.
Can I use MarketXLS inside Google Sheets?
Yes. The MarketXLS Google Sheets add-on brings the MarketXLS function library into Sheets, with the same pricing as regular MarketXLS. Streaming is Excel-only; in Sheets, values update on recalculation. Some functions differ by platform, so check /formulas.
Will MarketXLS formulas replace my GOOGLEFINANCE formulas?
In Excel, yes. GOOGLEFINANCE does not exist there, so MarketXLS is the data layer. In Google Sheets, you can use both side by side. A common pattern is to keep GOOGLEFINANCE for the simple price column and use MarketXLS for everything else.
Does MarketXLS support options data in Google Sheets?
Yes. Functions like =QM_GetOptionChainActive, =ImpliedVolatility, =ImpliedVolatilityRank1Y, and the OPT_* Greeks family are available through the MarketXLS add-on; options data is end-of-day on the Standard plan and real-time on Advanced and Business. GOOGLEFINANCE has no options data.
What about historical data?
GOOGLEFINANCE returns daily history reliably. MarketXLS extends that to =QM_GetHistory for daily, =QM_GetMinuteData for intraday bars, plus historical option chains via =OPT_HistoricalOptionChain, ten years of fundamental history, and dividend history per ticker. For backtesting and longer studies, the depth matters.
Can MarketXLS handle ETFs and indices?
Yes. ETF holdings, AUM, expense ratio, and asset class tags are exposed. Index quotes work through the same QM_Last function used for stocks.
The Bottom Line
You can use GOOGLEFINANCE and a market data add-on in the same Google Sheet. GOOGLEFINANCE is a free, built-in lookup for prices and basic ratios. Use it for personal trackers, classroom projects, and watchlists that never go deeper than price and a couple of ratios.
When you need dividend detail, fundamentals, technicals, options, ETF holdings, or intraday history, MarketXLS adds 1,000+ named functions across Excel and Google Sheets. You keep typing formulas; they return more data.
If you want to see how the next layer fits into your workflow, book a demo or explore the full feature set. The download links above give you a sample workbook and a live template so you can poke at the formulas before you commit to anything.
